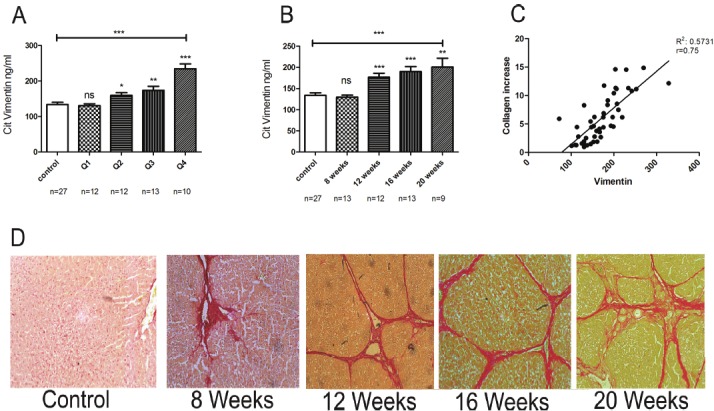
Figure 2.

Citrullinated vimentin levels in serum from CCl4-treated rats, stratified in quartiles according to total collagen in the liver as measured by quantitative histology (Q1 P>0.5, Q2 P<0.5, Q3 P<0.05, Q4 P<0.0001) (A), treatment duration (8 weeks P>0.05, 12 weeks P>0.001, 16 weeks P>0.005 and 20 weeks P>0.005) (B) and correlation of the citrullinated vimentin marker with total collagen increase as measured by quantitative histology (C). Comparisons are between controls of each group vs. treatment period and collagen quartile. Serius red histology images from different treatment points, showing progressive fibrosis development during CCl4 treatment (D).
