
Figure 3.
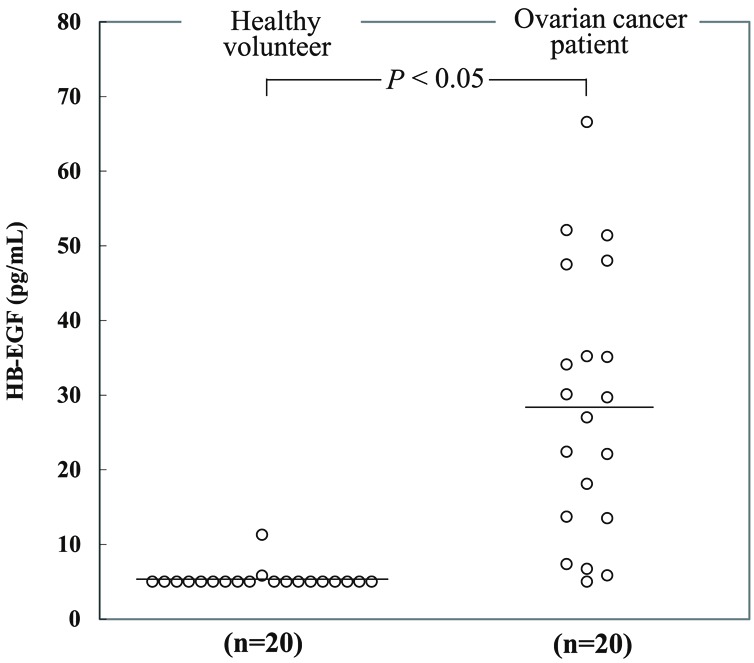
Comparison of serum HB-EGF concentrations determined by immuno-PCR method between healthy volunteers (n=20) and ovarian cancer patients (n=20). The lower limit of quantification was 5 pg/mL, and serum HB-EGF levels below the limit of quantification were regarded as 5 pg/mL. Open circles represent the individual HB-EGF levels. Bars indicate mean. The result of Welch’s t test was P<0.05, suggesting that there was a statistically significant difference between the values of healthy volunteers and ovarian cancer patients.