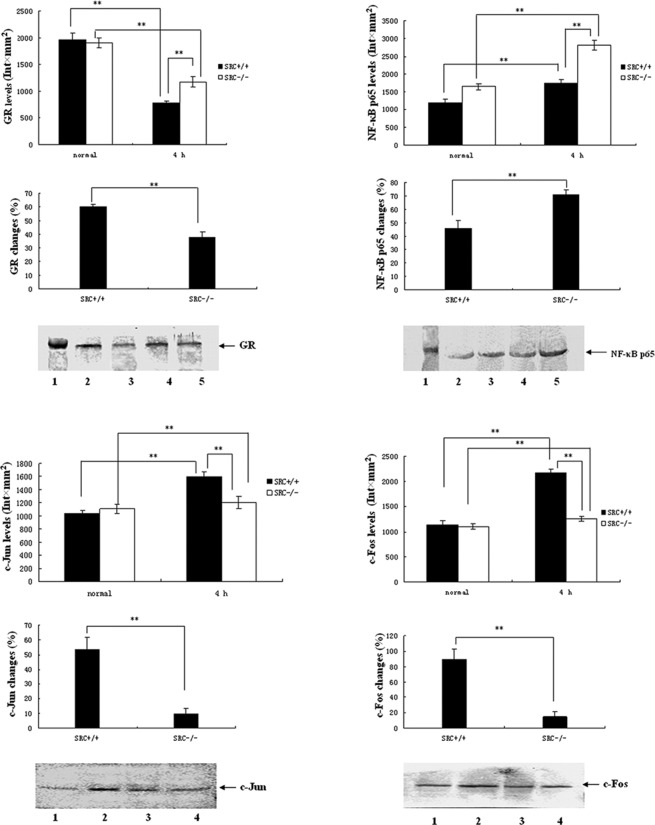
Figure 3.
Protein expression analysis by Western blotting. (A-D) Protein expression of GR, NF-κB p65 and AP-1 (c-Jun and c-Fos) in PMs from SRC-3+/+ and SRC-3−/− mice at 0 h (normal) and 4 h after injection of LPS (i.p., 5 mg/kg), respectively. (A) Protein expression of GR in PM. Lane 1, 98-kDa marker; lanes 2 and 3, 0 and 4 h after injection of SRC-3+/+ mice; lanes 4 and 5, 0 and 4 h after injection of SRC-3−/− mice. (B) Protein expression of NF-κB p65 in PM. Lane 1, 66-kDa marker; lanes 2 and 3, 0 and 4 h after injection of SRC-3+/+ mice; lanes 4 and 5, 0 and 4 h after injection of SRC-3−/− mice. (C) Protein expression of c-Jun in PM. Lanes 1 and 2, 0 and 4 h after injection of SRC-3+/+ mice; lanes 3 and 4, 0 and 4 h after injection of SRC-3−/− mice. (D) Protein expression of c-Fos in PM. Lanes 1 and 2, 0 and 4 h after injection of SRC-3+/+ mice; lanes 3 and 4: 0 and 4 h after injection of SRC-3−/− mice. Data are expressed as the means ± SEM per time point (n=5). **p<0.01.

