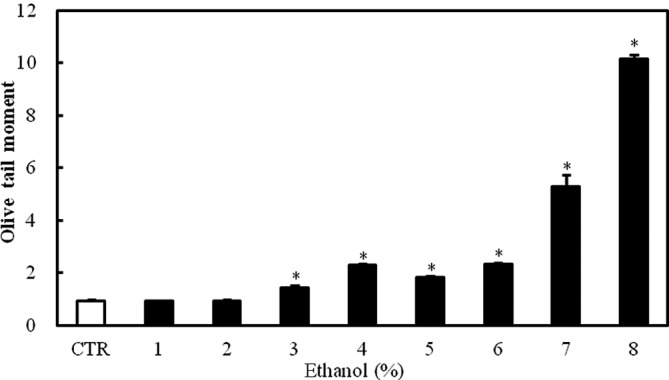
Figure 2.

Effect of graded ethanol concentrations (1–8%) on DNA damage in Caco-2 cells as assessed by the comet assay. The figure shows the distribution of Olive tail moments, which indicate DNA damage, in Caco-2 cells exposed to ethanol. Values are mean ± SD. *P<0.05 versus control.
