
Figure 4.
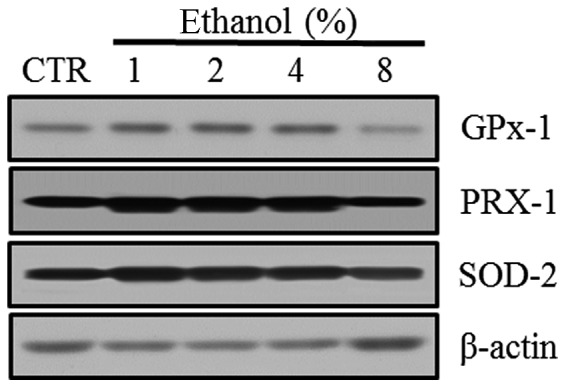

Effect of ethanol on antioxidant enzymes in Caco-2 cells. (A) Western blot analysis of GPx-1, PRX-1 and SOD-2. (B) Quantitation of the relative expression intensity of GPx-1, PRX-1 and SOD-2. Values are mean ± SD. *P<0.05 versus control (CTR). GPx-1, glutathione peroxidase-1; PRX-1, peroxiredoxin-1; SOD-2, superoxide dismutase-2.