
Figure 5.
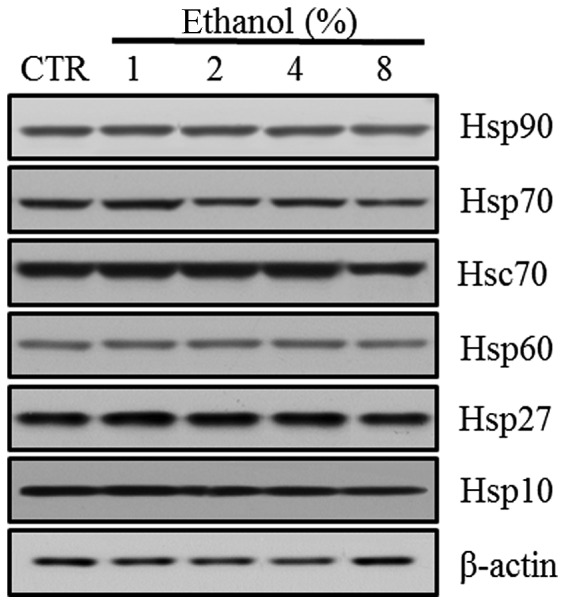

Effect of ethanol on Hsps in Caco-2 cells. (A) Western blot analysis of Hsp10, Hsp27, Hsp60, Hsc70, Hsp70 and Hsp90. (B) Quantitation of the relative expression intensity of Hsp10, Hsp27, Hsp60, Hsc70, Hsp70 and Hsp90. Values are mean ± SD. *P<0.05 versus control (CTR). Hsp, heat shock protein; Hsc, heat shock cognate.