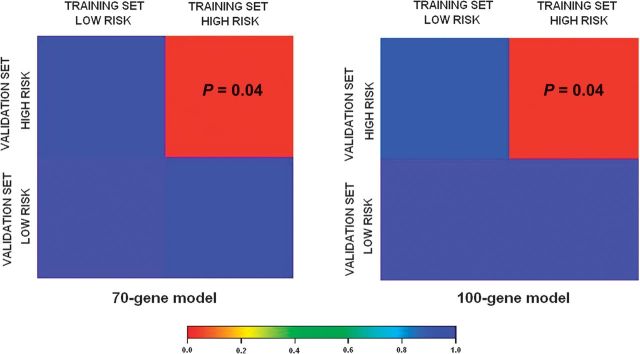
Figure 3.
Genome-wide molecular match of high- and low-risk groups between training and validation sets. Analysis of molecular correspondence between high- and low-risk groups in the training and validation sets. Red color denotes high confidence for correspondence; blue color denotes lack of correspondence. False Discovery Rate-adjusted P values are noted in the corresponding box.

