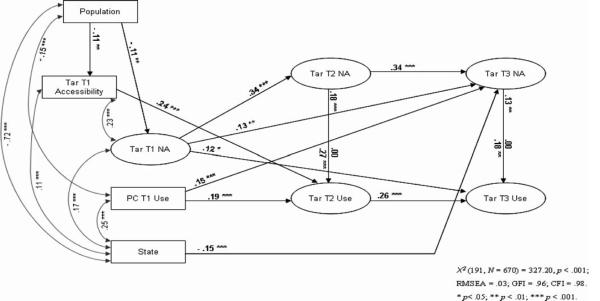
Figure. Structural Model of Population, Negative Affect, and Substance Use.
Source: Structural Model of Population, Negative Affect, and Substance Use
T1, Time 1; T2, Time 2; T3, Time 3; Par, parent; Tar, target adolescent; Accessibility, perceived substance accessibility (by targets); NA, negative affect; Use, substance use. For paired values, values above the line represent results for rural areas; values below the line represent results for urban areas (from the multigroup SEM analyses). State is coded: 0 = Georgia, 1 = Iowa; Population is coded: 0 = urban, 1 = rural.

