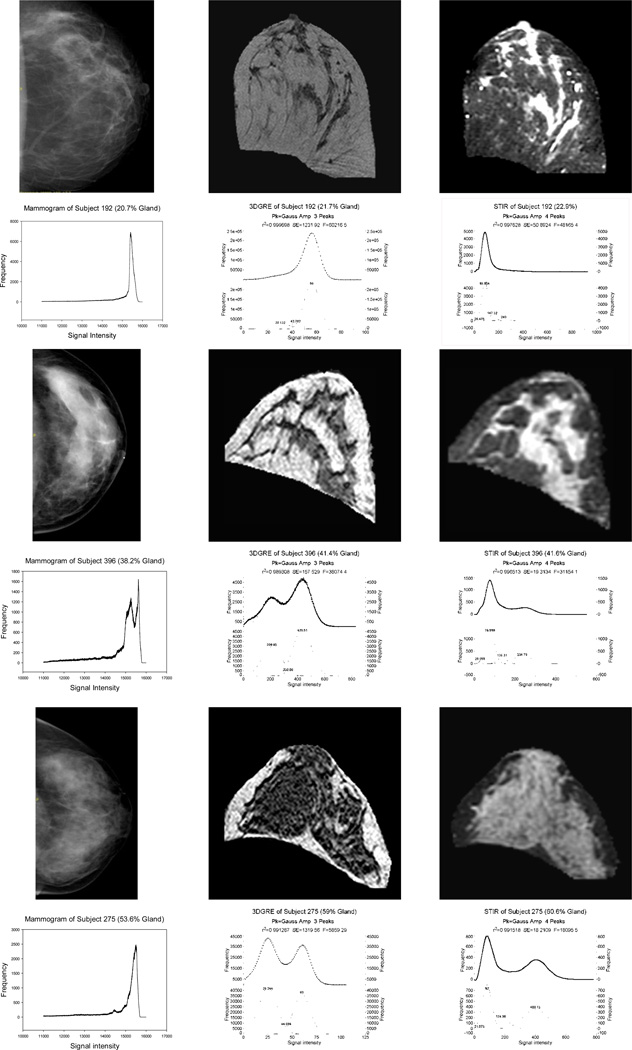
Figure 3.
Mammogram (first column), 3DGRE pulse sequence (second column), and STIR pulse sequence (third column) breast images and, beneath each image, the corresponding signal intensity histograms from 3 women with ~20% G (first two rows for subject 192), ~40% G (third-fourth rows for subject 396), and 60% G (fifth-sixth rows for subject 275). Histograms for 3DGRE and STIR have 2 curves, the upper curve representing unfitted (dots) and fitted (line) curves and the bottom curve representing segmented peaks.

