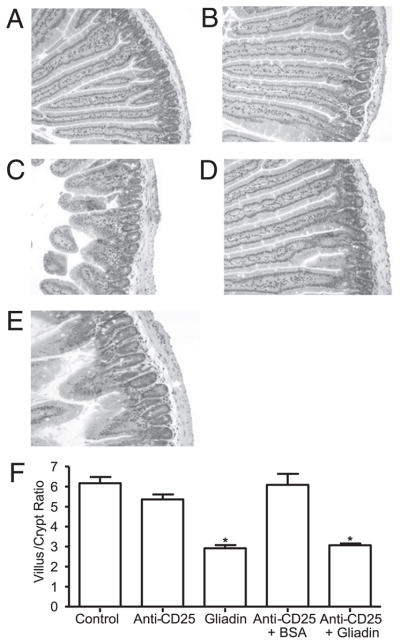
FIGURE 2.
Histopathology of the small intestine showing decreased villus-to-crypt ratio in gliadin-sensitized NOD-DQ8 mice. H&E-stained sections of the proximal small intestine in untreated controls (A) and anti-CD25 mAb-treated (B), gliadin-sensitized (C), anti-CD25 mAb treated plus BSA-sensitized (D), and anti-CD25 mAb treated plus gliadin-sensitized mice (E). Original magnification ×10. F, Quantification of villus/ crypt ratios (n = 8 for each group). Data represented as mean ± SEM; p values were computed using an ANOVA with a post hoc test for multiple comparisons. *p < 0.05 versus control mice, anti-CD25 mAb treated mice, and anti-CD25 + BSA-treated mice.

