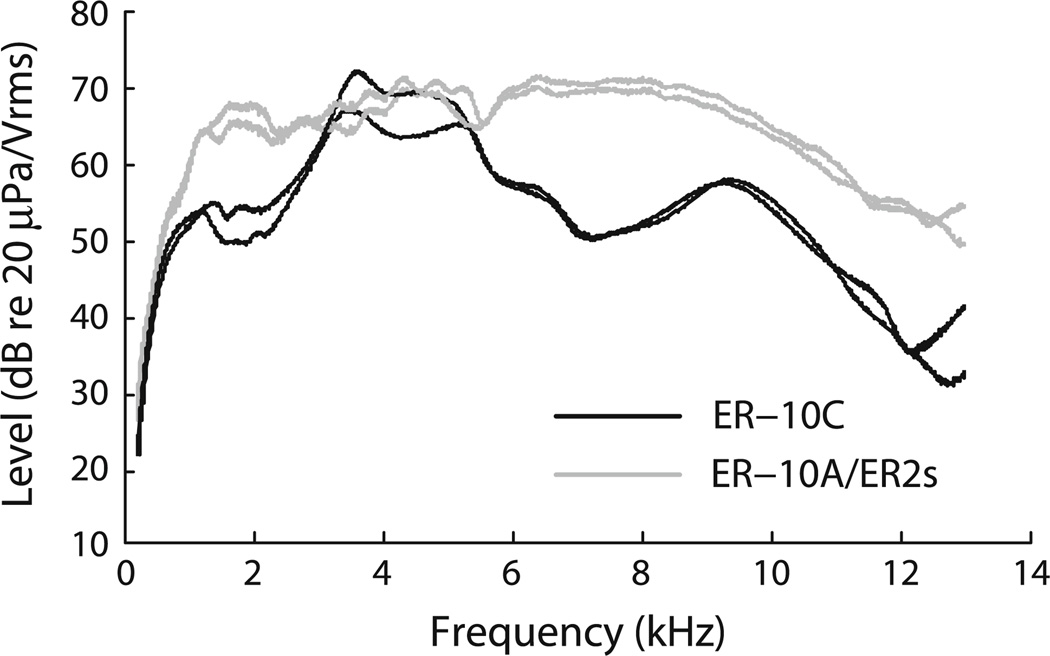
Fig. 1.
Earphone calibration curves obtained in situ from two different tigers using two different OAE probe assemblies. The ordinate indicates output for a 1 V rms drive. Dark curves are for an Etymōtic ER-10C, while the grey curves are from an assembly housing an Etymōtic ER-10A microphone and two Etymōtic ER2 earphones

