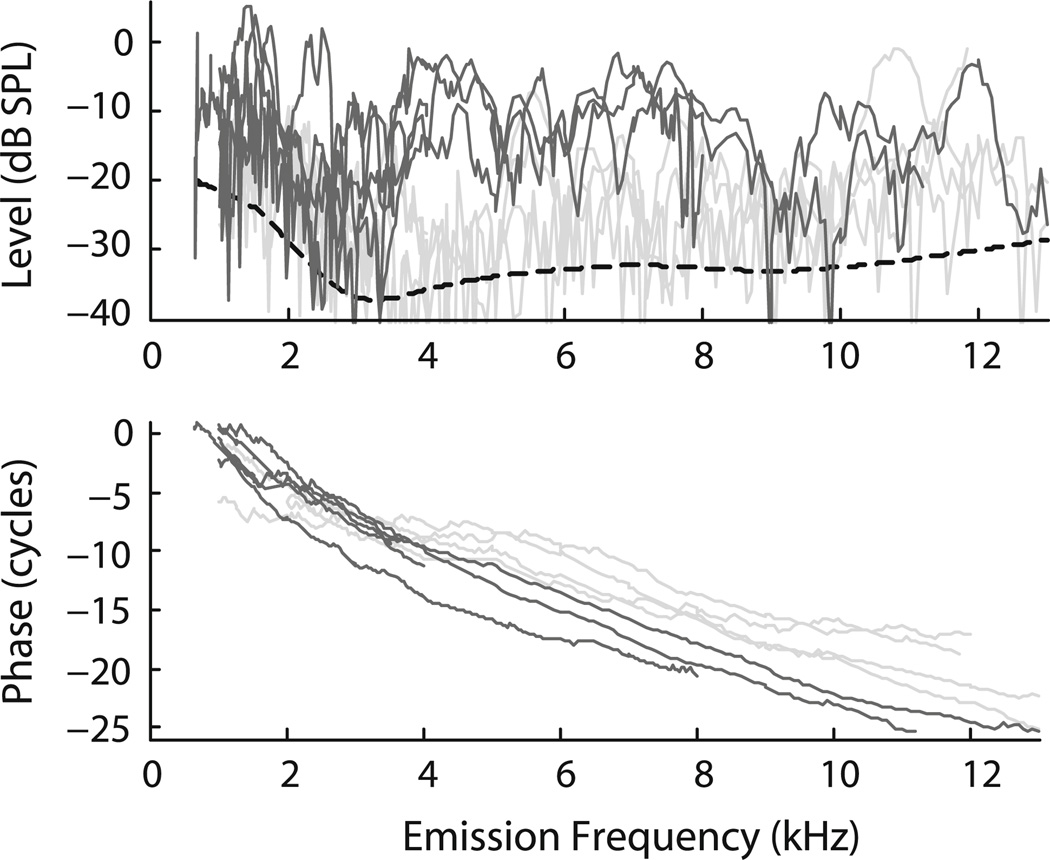
Fig. 2.
Tiger SFOAEs (magnitude and phase) measured at Lp = 40 dB SPL. Data are from 9 ears from 5 tigers. The dashed curve shows an estimate of the mean noise floor obtained by loess smoothing the noise floors measured in the individual animals. Data from the three younger tigers (one 3-year-old and two 5-year-olds) are indicated by darker shading and the data from the older tigers (two 10-year-old tigers) by lighter shading. Individual phase curves were shifted vertically by an integer number of cycles to maximize their overlap

