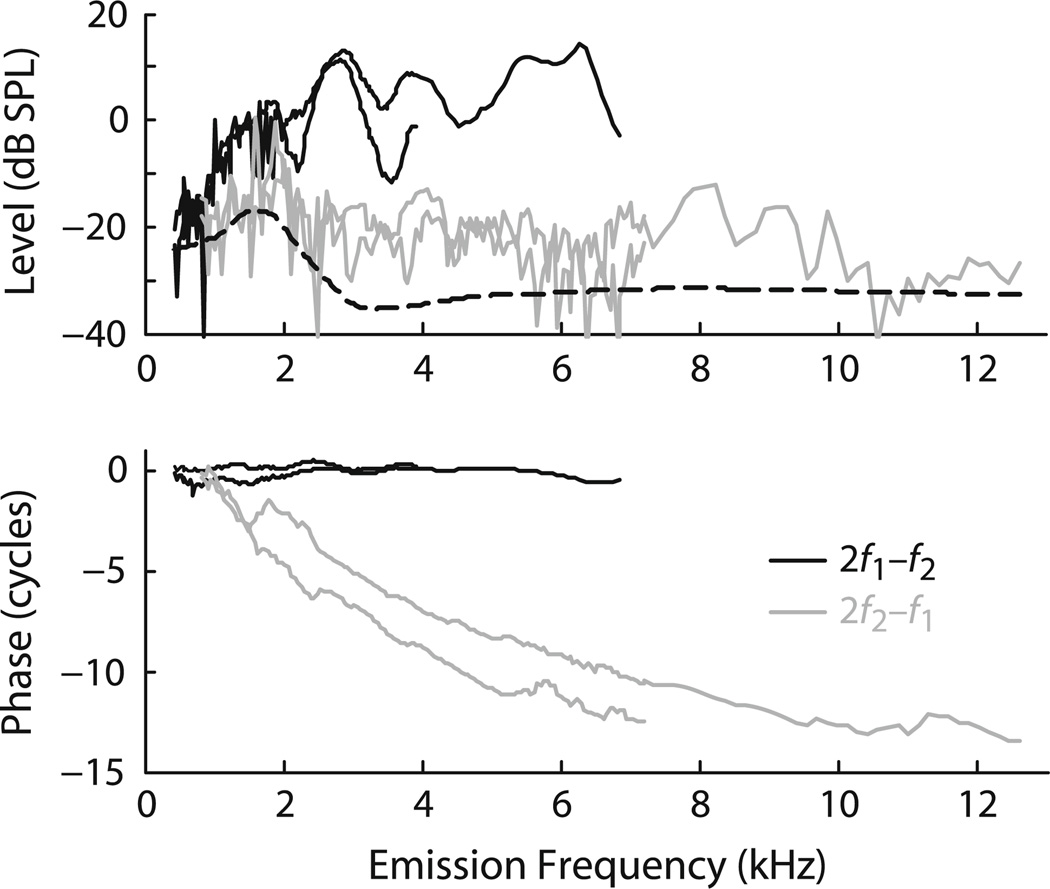
Fig. 3.
Tiger DPOAEs from the two older animals. The figure shows the magnitude and phase of both the lower- and upper-side band cubic distortion products (2f1 - f2 dark curves, 2f2 - f1 grey curves). The dashed line provides an estimate of the mean noise floor obtained by loess smoothing. The phase curves have been corrected for approximate ear-canal delays. The stimulus parameters were L1 = L2 = 65 dB SPL and f2/f1 = 1.22

