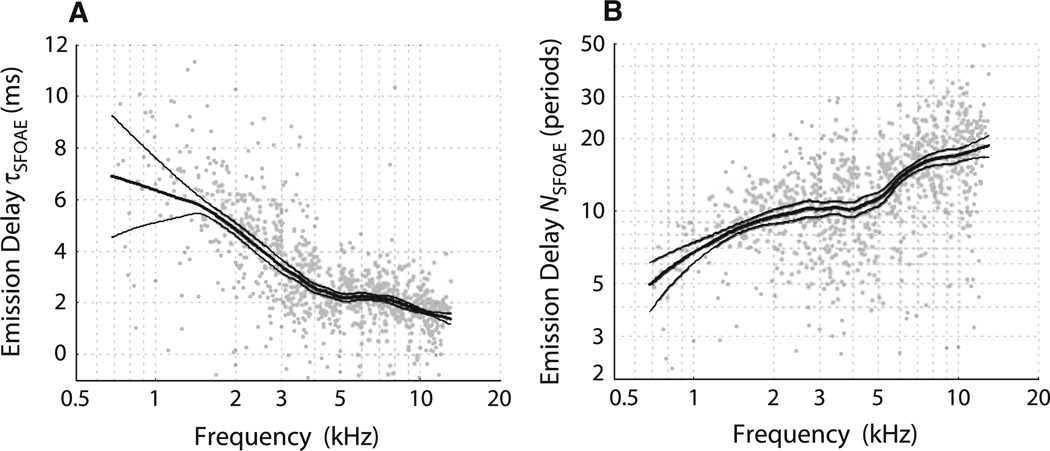
Fig. 4.
Tiger SFOAE phase-gradient delays computed from the phases shown in Fig. 2, expressed either in milliseconds (a) or stimulus periods (b). Only points whose corresponding magnitude was at least 10 dB above the noise floor are included. Thick lines indicate loess trends; thin lines indicate 95 % confidence intervals computed via bootstrap resampling

