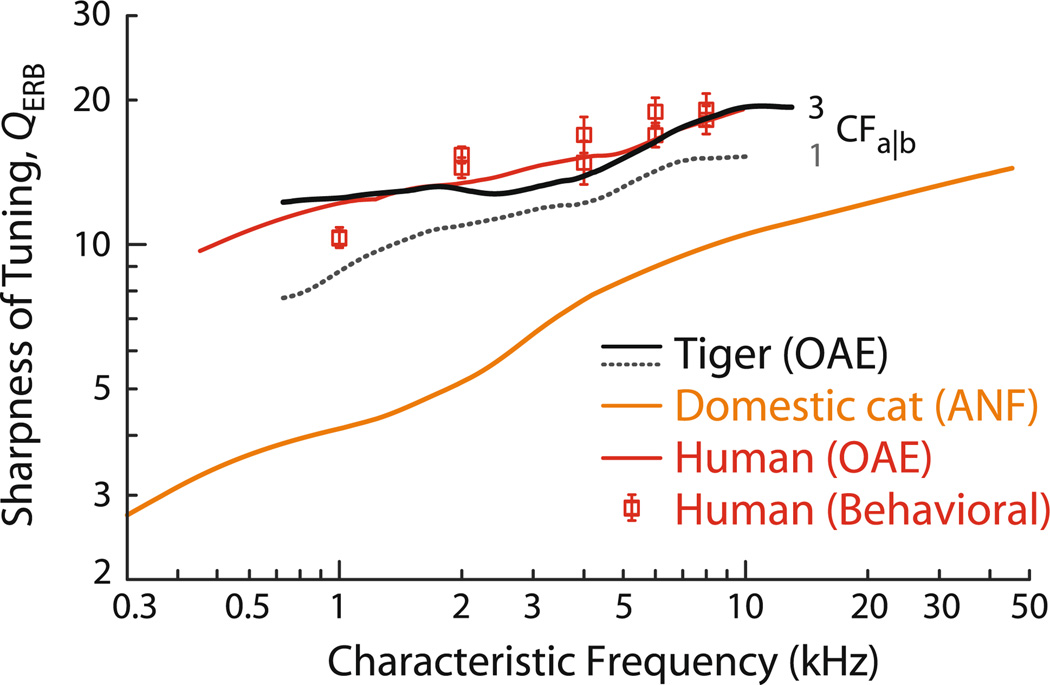
Fig. 6.
Otoacoustic estimates of QERB for tiger. Estimated values of QERB were computed from the measured values of NSFOAE using Eq. (1) and the assumption that tiger tuning ratios are the same as those of domestic cat. Results are shown for two different values of the apical—basal transition CF: the solid black line assumes CFa|b = 3 kHz, similar to domestic cat; the dotted black line assumes CFa|b = 1 kHz, similar to human. QERB trends for cat and human are shown for comparison. The cat QERB trend was obtained from auditory-nerve fiber (ANF) data (Shera and Guinan 2003; Joris et al. 2011); the human values derive from otoacoustic estimates and behavioral experiments (Shera et al. 2002, 2010)

