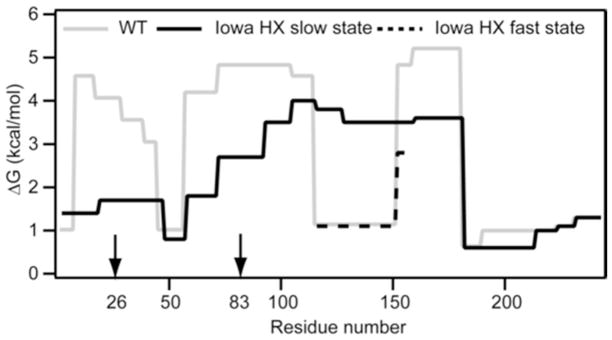
Figure 5.
Summary of the HX-derived secondary structure stabilities for lipid-free apoA-IWT and apoA-IIowa. Detailed HX kinetic data (pD 7.3, 5°C) analyzed to obtain Pf values for 51 peptides are in Table S1. The corresponding free energies of stabilization are plotted as a function of apoA-I sequence position. The profile for apoA-IWT (solid grey line) is from data for peptide fragments obtained by proteolysis with pepsin; the results are consistent with our prior findings where both pepsin and a fungal protease were used to obtain shorter peptides, including some suggesting that residues 66–69 are disordered (10). For peptides encompassing apoA-IIowa residues 114–158 with bimodal HX kinetics (Fig. S1), the free energies of both states are included (solid black line, slow HX state; dashed black line, fast HX state). The similar free energies of the fragment 17–46 fast and slow HX states (Fig. 2b) are plotted as an average. The vertical arrows on the sequence position axis mark the mutation site at residue 26 and the proteolytic site at residue 83.

