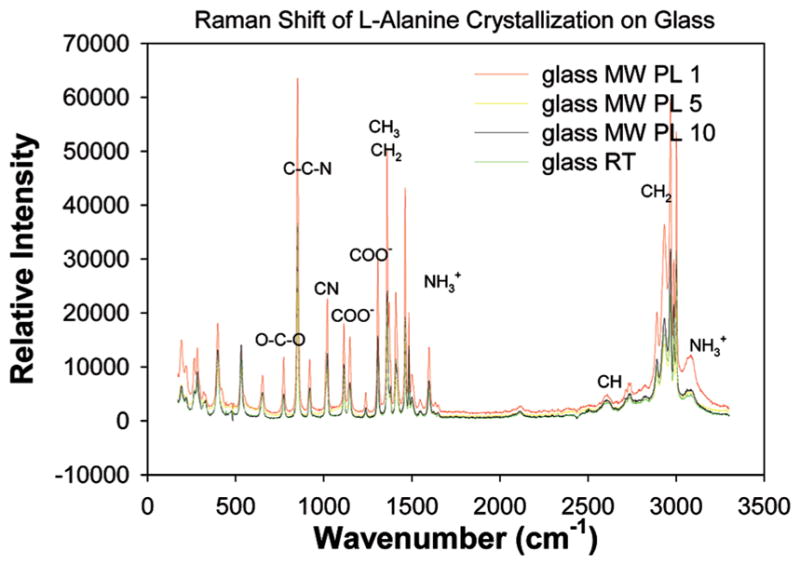
Figure 4.

Raman spectrum of L-alanine crystallized on blank glass slides at room temperature and using the MA-MAEC technique. Notation of functional groups at peaks signifies the presence of a functional group at the indicated wavelength.

Raman spectrum of L-alanine crystallized on blank glass slides at room temperature and using the MA-MAEC technique. Notation of functional groups at peaks signifies the presence of a functional group at the indicated wavelength.