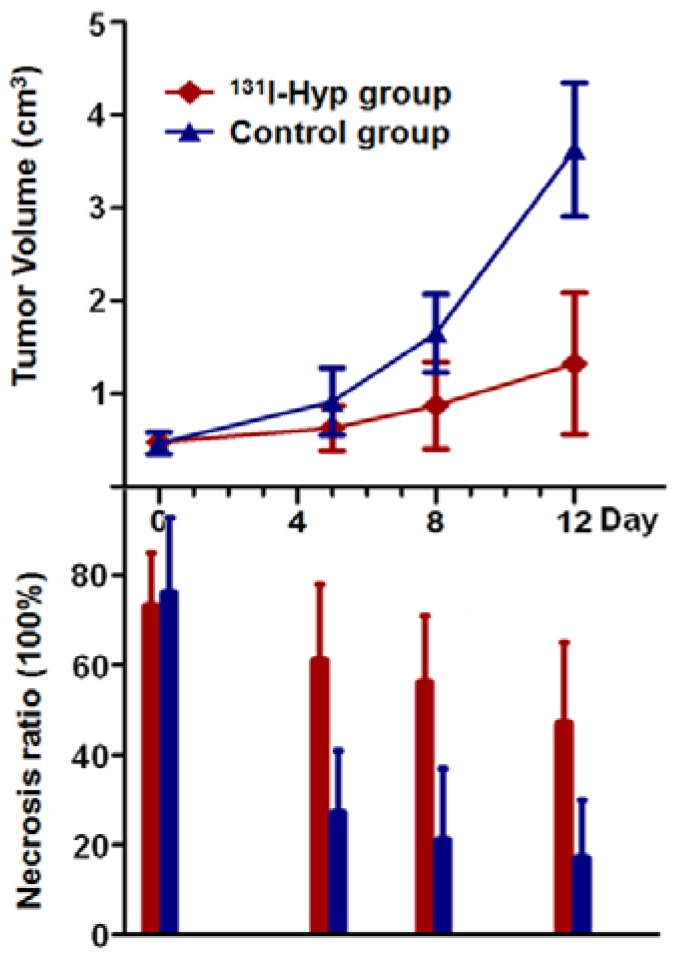
Figure 6.
Tumor growth curve and the corresponding necrosis ratios on day 0, 5, 8, 12 post treatment. No significant difference was found in either tumor volume or tumor necrosis ratio between the two groups on day 0. Tumor volume in 131I-Hyp group was found significantly smaller than that of CA4P control group (p < 0.01) from day 5 on. Necrosis ratio measured from MR images presented a significant difference (p < 0.05) between the two groups from day 5 on.

