
Fig. 8.
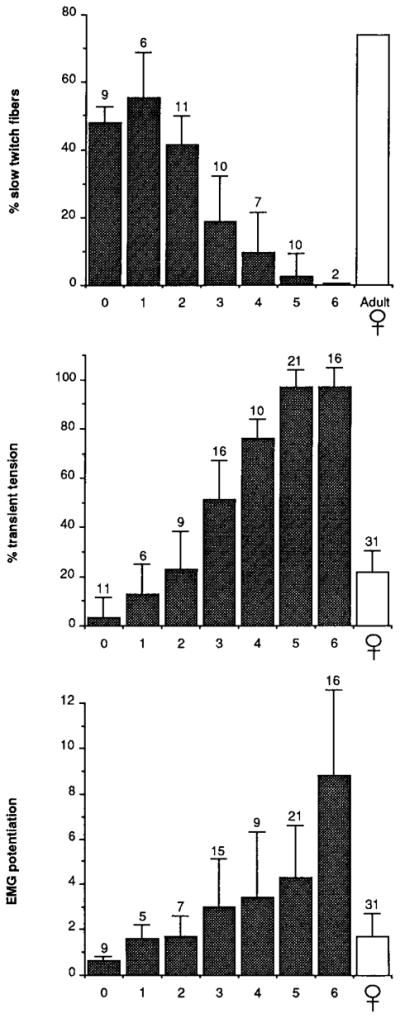
Average values for male percentage of slow twitch fibers, percentage of transient tension, and EMG potentiation at each stage in postmetamorphic development. Female values (mean of PM1 through PM6) are shown for comparison in percentage of transient tension and EMG potentiation graphs; adult female values (from Sassoon et al., 1987) are shown in percentage of slow twitch fibers graph. Bars represent mean ± SD. The number of animals included in each bar is indicated above the bar. All properties show a marked increase in masculinization between PM2 and PM3.