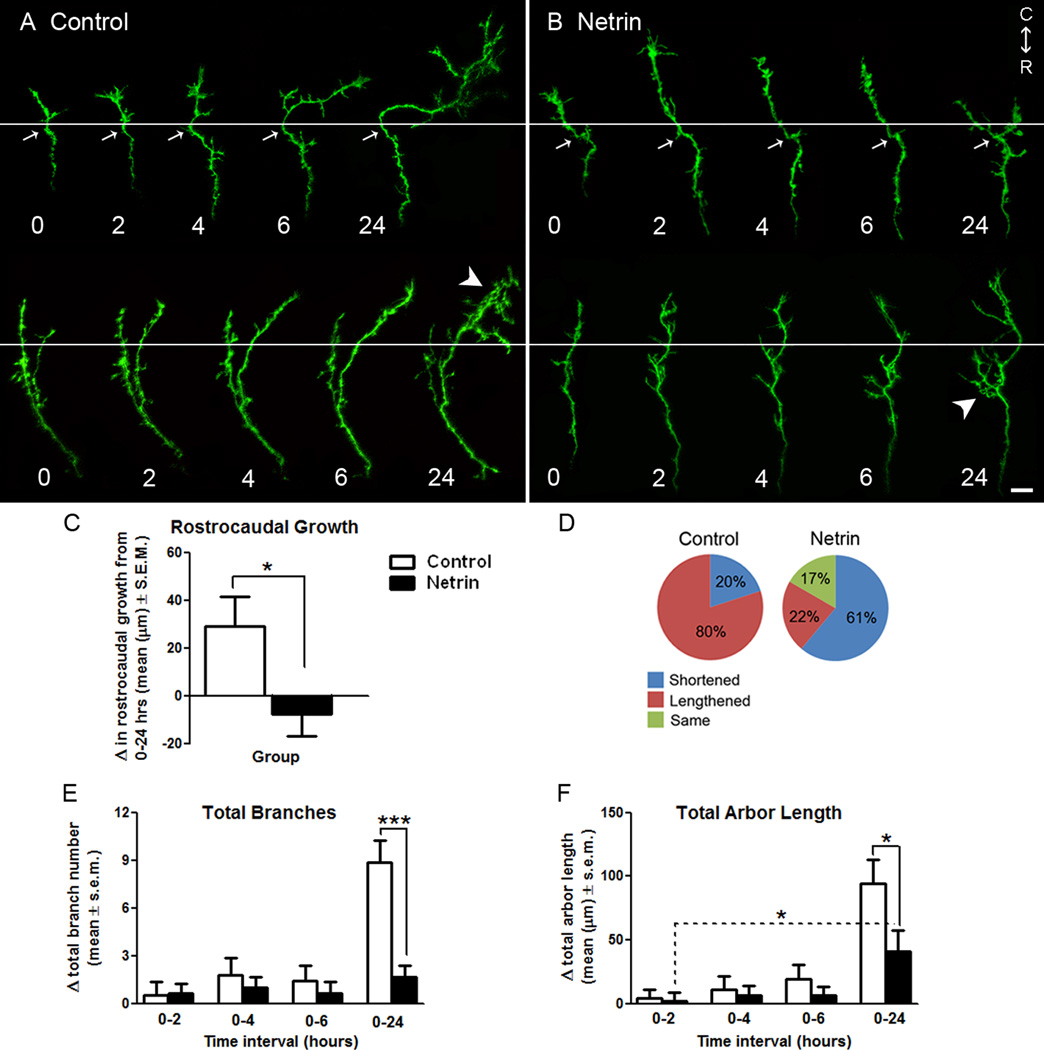
Figure 1. Netrin influences the forward advancement and morphology of RGC axon growth cones at their target.
A, B) Representative reconstructions of control (A), and netrin-treated (B), RGC axon growth cones in stage 40 tadpoles expressing EYFP imaged by time-lapse confocal microscopy over 24 hours. White horizontal lines delineate the forward-back branching boundary used for quantification of axon growth (also see diagram in Fig. 2 A). White arrows indicate examples of intrinsic landmarks (bends in the axon) common to all time points that were used to align images. White arrowheads demarcate differences in the branching patterns of growth cones exposed to control vehicle solution or recombinant netrin (see Fig. 2). Illustrated portions of the axons lie completely within the optic tectum, and rostral to caudal (R-C) orientation of the brain is indicated. Scale bar, 10 µm. C, D) A measure of rostro-caudal growth is provided by the change in length of axons exposed to control or netrin treatment over a 24 hour period (C), as well as the proportion of axons that lengthened, shortened or remained the same length throughout the observation period (D). Note that while the majority axons in control tadpoles lengthened, axons exposed to netrin-1 shortened over time or remained the same length. E, F) The effects of netrin-1 treatment on RGC axon growth cones of stage 40 tadpoles were further determined by quantifying the changes in total branch number (E), and total arbor length (F), at each time point relative to time 0. While changes in total branch number and length were similar for axons in control and netrin-treated tadpoles during the first six hours of imaging, a delayed effect of netrin is observed on branch number and length by 24 hours. Dotted lines indicate within group comparisons; solid lines represent between group comparisons. * signifies p < 0.05, *** p < 0.0005. Error bars indicate SEM.

