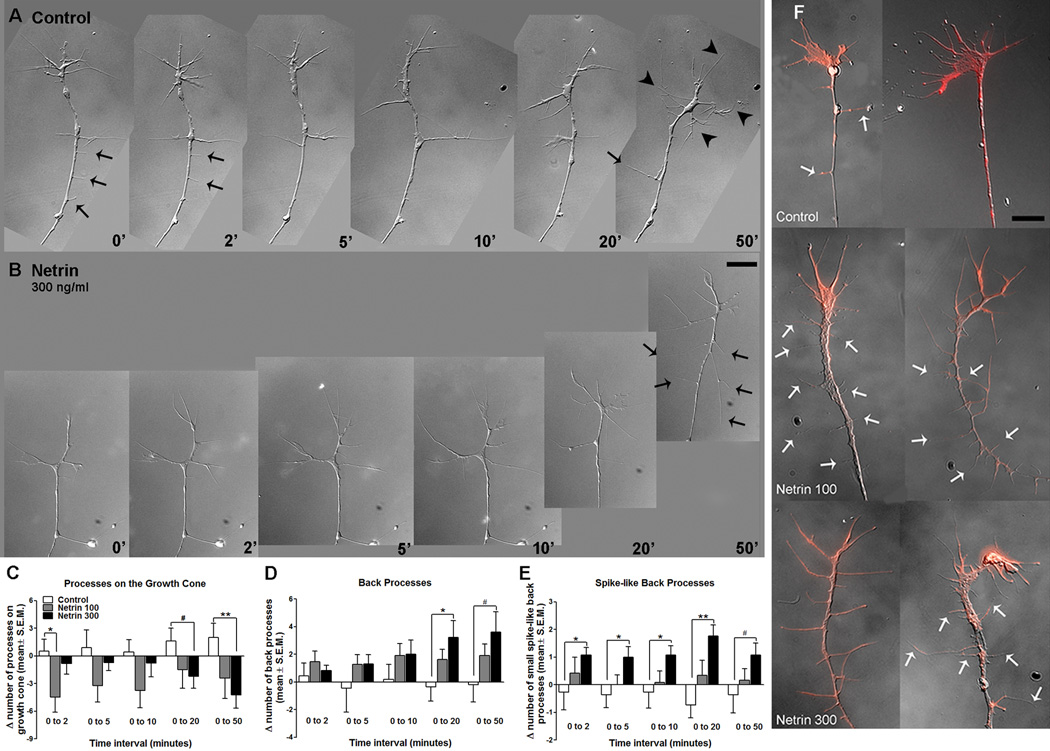
Figure 8. Netrin-1 induces extension of filopodial processes behind the growth cone in RGC axons in culture.
A, B) Time-lapse sequence of sample RGC axon growth cones imaged in culture under control conditions (A) and following acute exposure to netrin-1 (B). Black arrowheads point to filopodial processes at the growth cone in A, and arrows point to processes behind the growth cone in A and B. These representative time-lapse images illustrate differences in the extension of filopodial processes in control and netrin-treated (300 ng/ml) growth cones. Scale bar, 10 µm. C) Quantitation of changes in number of filopodial processes at the growth cone show that netrin treatment results in growth cones with fewer growth cone processes than controls. D, E) The number of processes behind the growth cone, along the axon shaft (D; back processes), as well as the number of short, spike-like processes (less than 1.5 µm; E) behind the growth cone are increased after netrin treatment. F) Representative growth cones in fixed cultures one hour post-treatment, stained with rhodamine phalloidin (red), illustrate the decrease in the number of filopodial processes on the growth cone in RGC axons in cultures exposed to netrin. White arrows indicate back processes. Scale bar, 10 µm. *p < 0.05, and **p < 0.005. Error bars indicate SEM.

