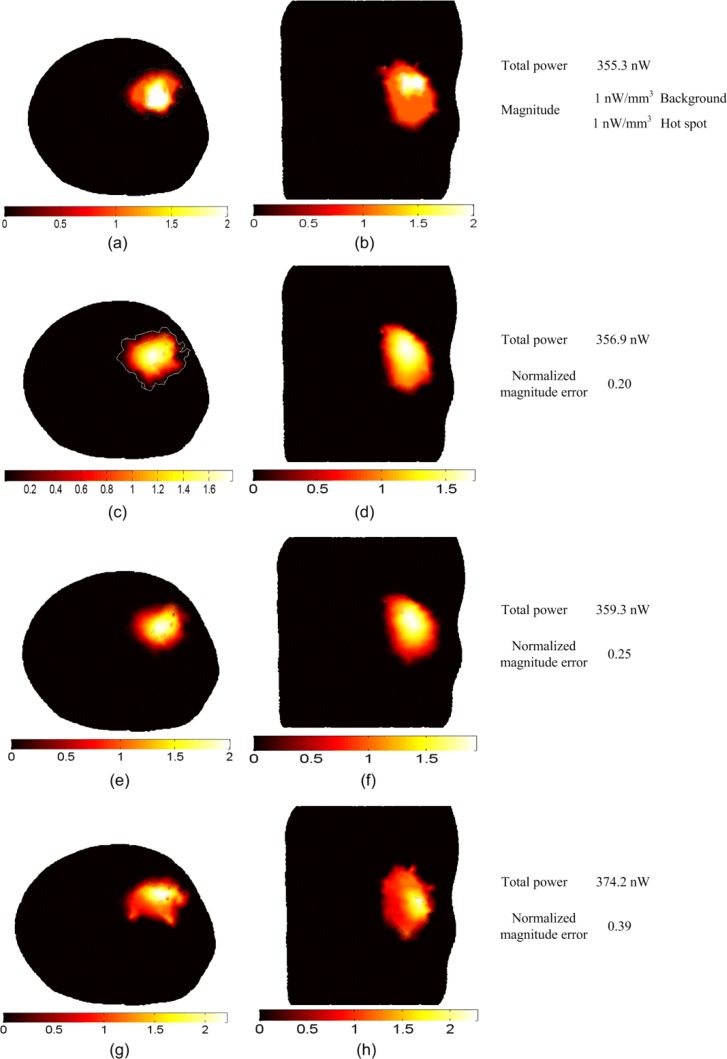
Fig. 5.
BLT reconstruction of a large non-uniform source distribution that fills the entire right kidney. The actual source in (a) and (b) has a hot spot of 4 mm diameter with magnitude 2 nW/mm3 which is twice the magnitude of the background. The reconstructed source in (c) and (d) using the absolute data, (e) and (f) using the relative data, and (g) and (g) using the imperfect calibrated data. The total powers of the actual and reconstructed sources and the normalized magnitude errors of the reconstructed sources using different reconstruction methods are shown in the figure.

