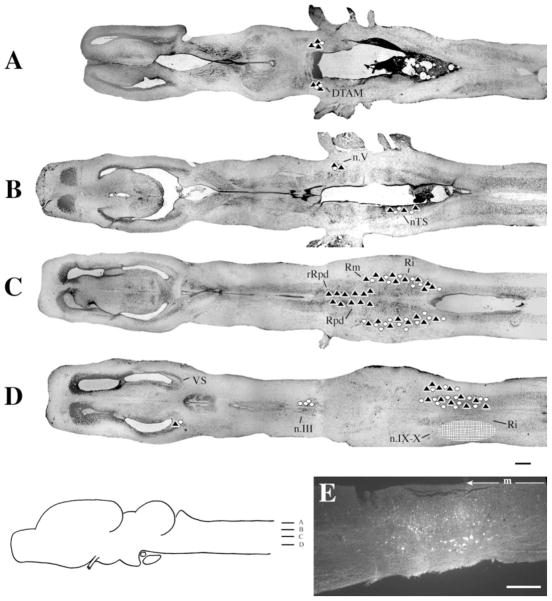
Fig. 3.
Injections into n.IX-X. A–D: Black triangles indicate labeled terminal fields; white circles indicate labeled cells; the hatched area indicates the location and extent of a typical injection site. E: Photomicrograph of a typical injection site. m, midline. For other abbreviations, see list. Scale bar = 500 μm in D (applies to A–D), 300 μm in E.

