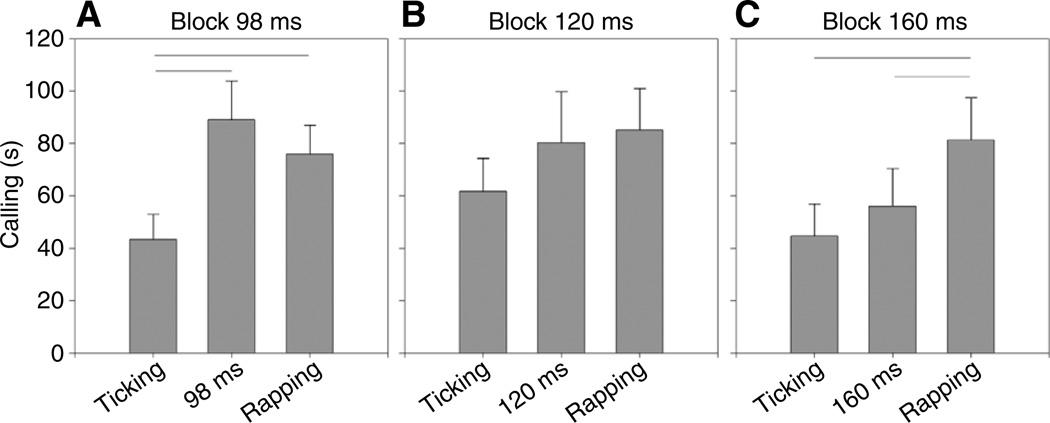
Fig. 4.
Mean and standard error of time spent calling in response to each playback stimulus during the three testing blocks (A–C). Horizontal lines indicate which columns are significantly different (P<0.05, RM-ANOVA, Fisher’s PLSD). (A) The response to the fastest intermediate stimulus (98 ms ICI) was significantly greater than the response to the ticking stimuli (219 ms ICI) presented during the same block. (B) Calling to the middle intermediate stimulus (120 ms ICI) was not significantly different from calling to the other two stimuli presented on the same nights (219 and 180 ms ICI). (C) The slowest intermediate stimulus (160 ms ICI) elicited calling that was significantly lower than calling to rapping stimuli (81 ms ICI) heard on the same nights.

