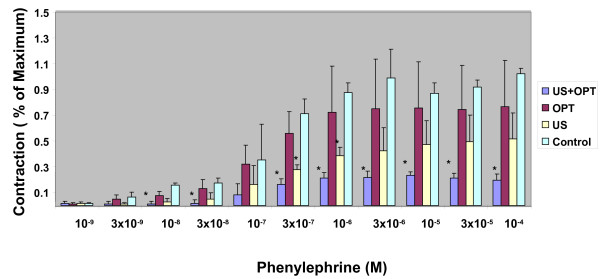
Figure 3.
Effect of US and US contrast agent upon phenylephrine-induced aortic contraction. Results are expressed as a percentage of the phenylephrine contraction in the control aortas. N = 3; Significant differences of treated vs. control * = p < .05. The results are representative of three experiments.

