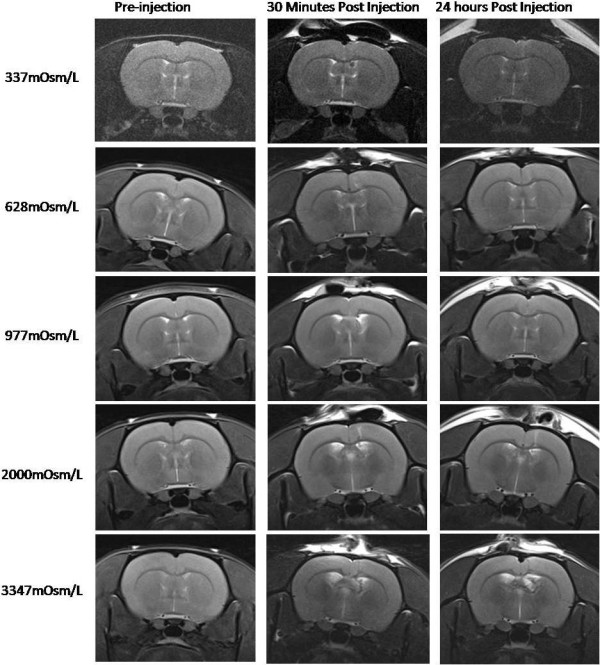
Figure 3.

Coronal T2-weighted MR images obtained from representative animals from Group I (337 mOsm/L), Group II (628 mOsm/L), Group III (977 mOsm/L), Group IV (2000 mOsm/L) and Group V (3347 mOsm/L) in Experiment 1. MR images were acquired pre-infusion (column 1), at the end of 30 mins (column 2) and at 24 hours (column 3) following injection.
