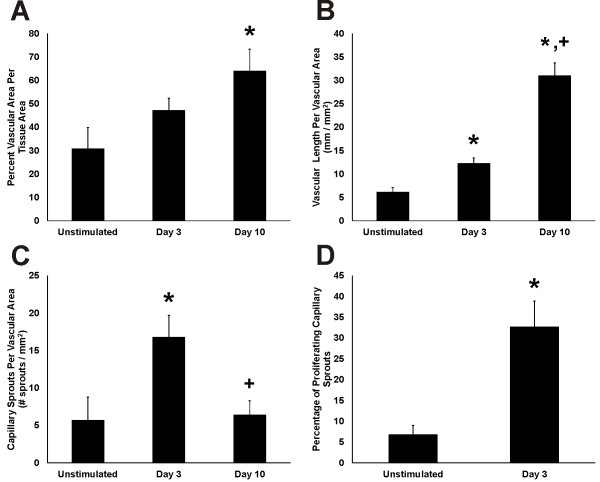
Figure 5 .
Quantification of microvascular network growth in response to stimulation of mast cell degranulation by compound 48/80. A) Vascular area per tissue area. B) Vascular length per vascular area. C) Total number of sprouts per vascular area. D) Percentage of sprouts with at least one proliferating cell. *p < 0.05 compared to Unstimulated. +p < 0.05 compared to day 3.

