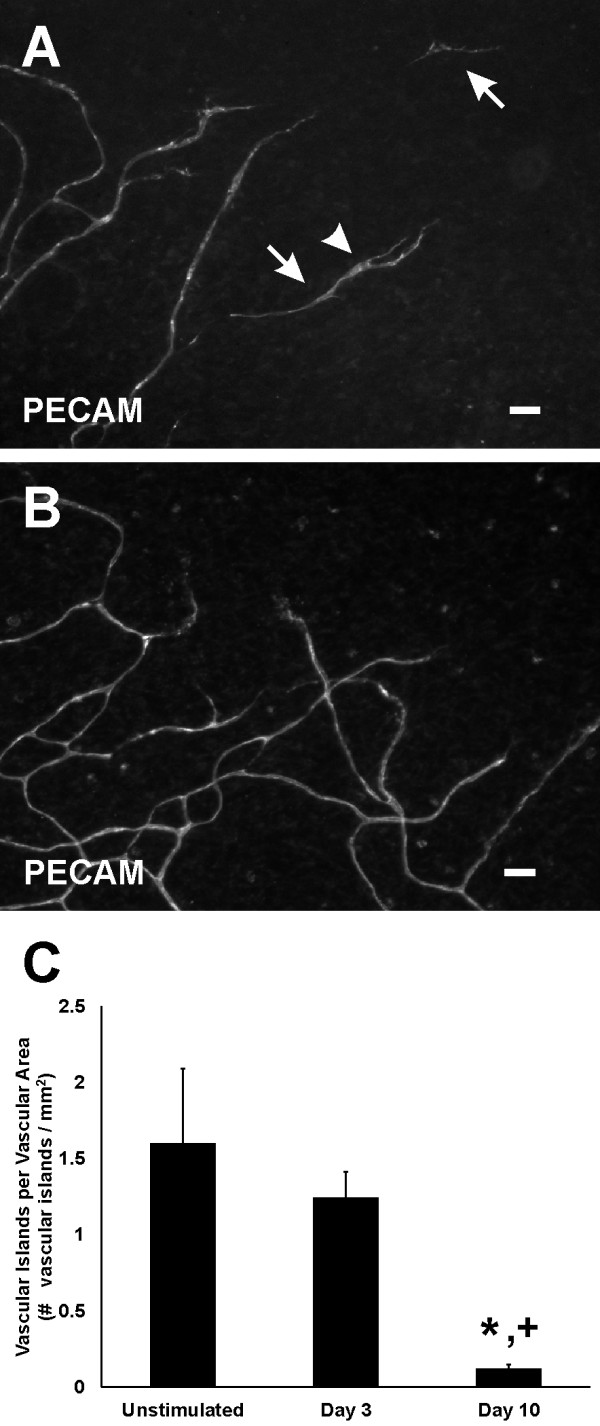
Figure 8 .

The presence of vascular islands over the time course of microvascular network growth. A) On day 3 vascular islands (arrows) were commonly located along the periphery of a network. Compared to the unstimulated scenario, day 3 vascular islands more frequently contained at least one branch point (arrowhead). B) By day 10 post stimulation, the presence of vascular islands was dramatically decreased. C) Number of vascular islands per vascular area. *p < 0.05 compared to Unstimulated. +p < 0.05 compared to Day 3. Scale bars = 50 μm.
