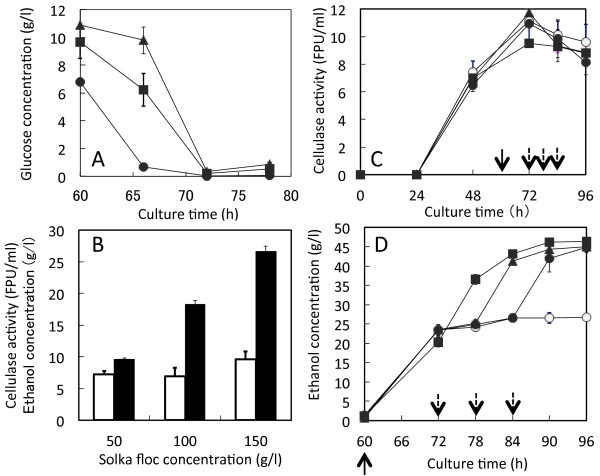
Figure 5.
One-pot bioethanol productions in a shake flask. (A) and (B): Co-culture of A. cellulolyticus and S. cerevisiae was carried out with different SF concentration, 50, 100, and 150 g/l. (C) and (D): Co-culture of A. cellulolyticus and S. cerevisiae was carried out with 150 g SF/l concentration at the culture time of 60 h, and another 150 g SF/l was added at 72 h. Similar co-cultures were done with 150 g SF/l concentration at the culture time of 60 h, and another 150 g SF/l was added at 78 h or 84 h. Symbols in A: closed circles, 50 g/l SF; closed squares, 100 g/l SF; closed triangles, 150 g/l SF. Bars in B: open bars, cellulase activity; closed bars, ethanol concentration. Symbols in C and D: open circles, without addition; closed squares, addition time 72 h; closed triangles, addition time 78 h; closed circles, addition time 84 h. Arrows indicate SF-addition times. Error bars denote standard deviation (n = 3). As determined by ANOVA analysis, the ethanol productions by increased SF concentration in B and D are significant at p < 0.05 and p < 0.005

