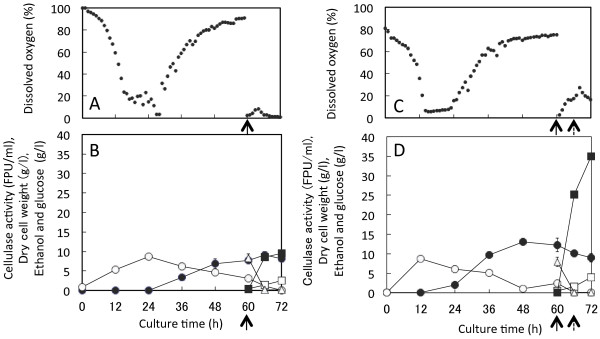
Figure 6.
One-pot bioethanol productions in a jar fermentor. (A) and (B): Co-culture of A. cellulolyticus and S. cerevisiae was carried out with addition of 50 g SF/l at the culture time of 60 h. (C) and (D): Co-culture of A. cellulolyticus and S. cerevisiae was carried out with addition of 150 g SF/l at the culture times of 60 and 66 h. Agitation rate was 500 rpm during cellulase production, but dropped to 200 rpm at the culture time of 60 h for ethanol production. Symbols in B and D: open circles, DCWA; closed circles, cellulase activity; open triangles, glucose concentration; open squares, DCWS; closed squares, ethanol concentration. Arrows indicate SF-addition times. Error bars denote standard deviation (n = 3). As determined by ANOVA analysis, the ethanol productions in B and D are both significant at p < 0.0001

