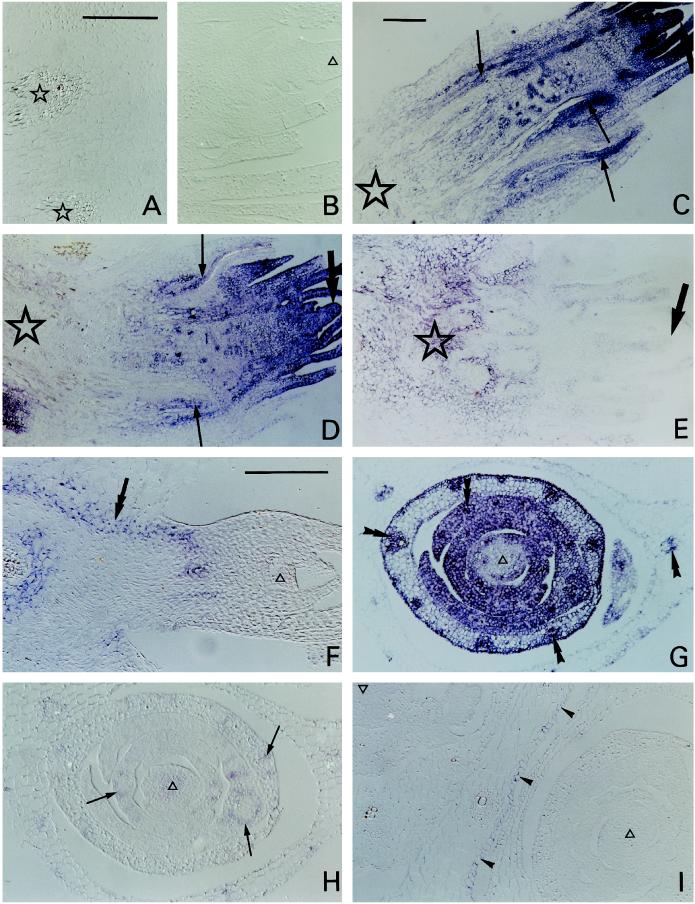
Figure 1.
Sections of barley crown hybridized with sense (A and B) or antisense (C–I) digoxigenin-labeled sequences. A blue-purple color indicates a positive signal. A and B, Longitudinal sections of the basal (A) and apical (B) region of the crown from cold-grown plants, hybridized with sense blt101 (A) or sense blt63 (B). Stars, Vascular bundles; ▵, tissue within the apical tip. C to E, Longitudinal sections of crowns from control (C) or cold-grown (D and E) plants hybridized with antisense blt63 (C and D) or antisense blt101 (E). Stars, Base; thick arrows, apex; thin arrows, stain (blt63) around developing vascular tissue. F, Longitudinal section of a subsidiary apex in the crown of a cold-grown plant hybridized with antisense blt14. Double arrow, Stain in the inner region of the cortex. G to I, Transverse sections of the apical regions of crowns from cold-grown plants hybridized with antisense blt63 (G), blt101 (H), or blt4.9 (I). ▵, Tissue within the apical tip; double arrowheads, stain (blt63) within vascular bundles in leaf initials; thin arrows, stain (blt101) around vascular bundles in leaf initials; arrowheads, stain (blt4.9) in one epidermis. C and G, Bright-field microscopy; A, B, D–F, H, and I, Interference contrast microscopy. Bars in A, C, and F = 200 μm (A and B are same scale; C to E are same scale; and F to I are same scale).

