
Figure 2.
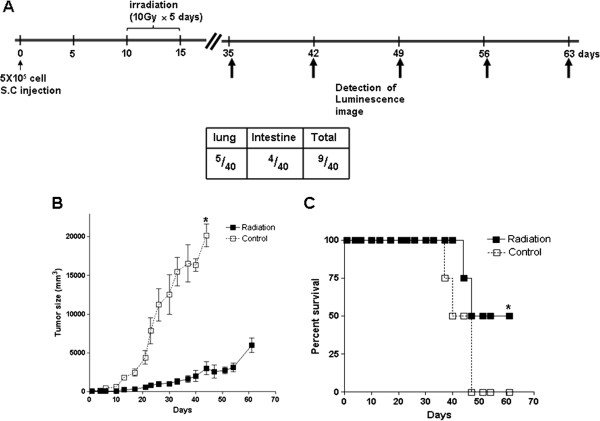
Treatment with γ-IR affects tumor size and percentage survival in mice. (A) Radiation treatment schedule (scheme, upper part) and occurrence of metastasis detected with bioluminescence imaging (box, lower part). (B) Detection of tumor sizes. Radiation (black square) indicates the γ-IR-treated group (n = 5) and control (white square) signifies the control group (n = 4). Tumor sizes of mice were detected as long and short axis lengths, and calculated as follows: (short axis length2 × long axis length)/2. The p values between γ-IR-treated and control groups were calculated with the t-test. *: p < 0.01 (p value = 0.0014). (C) Survival rates of mice. Survival rate was calculated as a percentage of each group. The p values between γ-IR-treated and control groups were obtained with the t-test. *: p < 0.01 (p value = 0.0063).