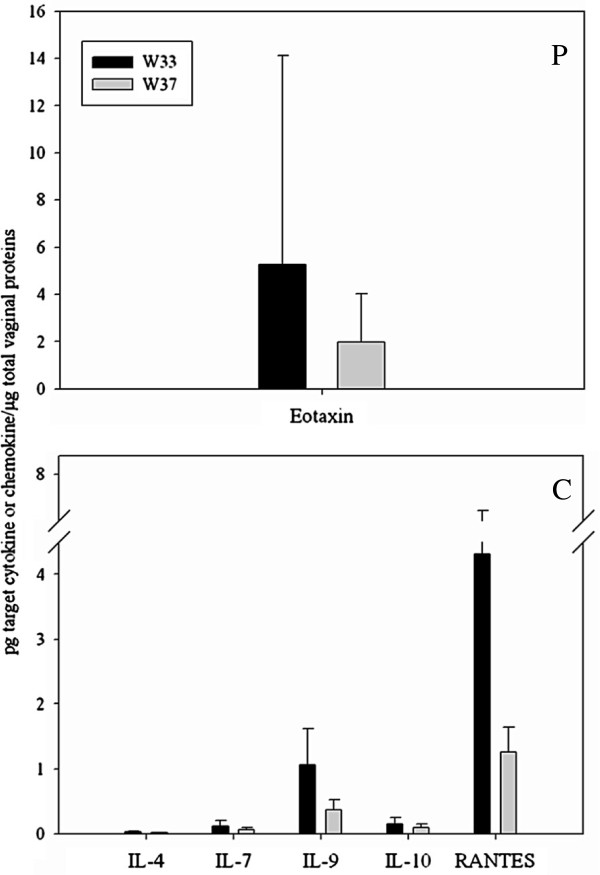
Figure 4.
Cytokines and chemokines whose concentration significantly changed during the study period (P<0.05). P, probiotic group; C, control group; W33, 33rd gestational week (black colour); W37, 37th gestational week (grey colour). Cytokine or chemokine names are reported in x-axis. Data are expressed as pg of the target cytokine or chemokine per μg of total proteins present in the vaginal sample (y-axis). The diagrams show means with error bars representing the standard deviations.

