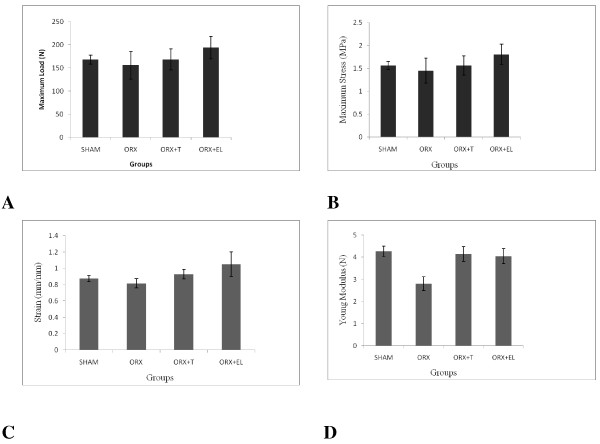
Figure 4.
A, B, C and D: The Load, Stress, Strain and Young Modulus for all the groups. Data were presented as mean ± SEM with significant difference p < 0.05. SHAM : Sham- operated group. ORX : Orchidectomized control group. ORX + T : Orchidectomized group treated by testosterone. ORX + EL : Orchidetctomized group treated with EL.

