
Figure 4. Simulated dengue incidence in a single year.
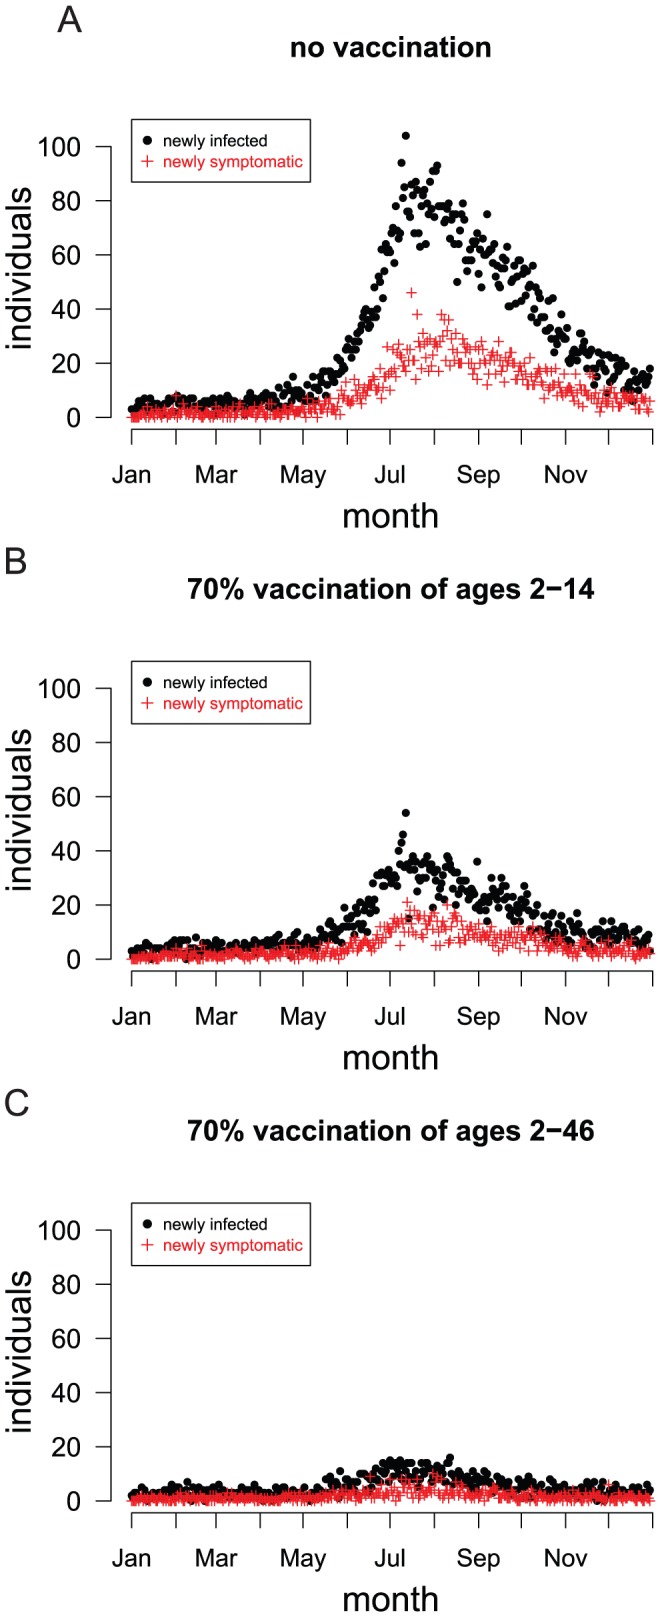
Each plot shows the daily number of newly infected and symptomatic people from a single representative stochastic simulation. (A) A simulation in which no vaccination took place (baseline scenario). (B) A randomly selected 70% of the population aged 2 to 14 years was vaccinated. (C) A randomly selected 70% of the population aged 2 to 46 years was vaccinated. The vaccine confers protection to 70% of vaccinees in the model.