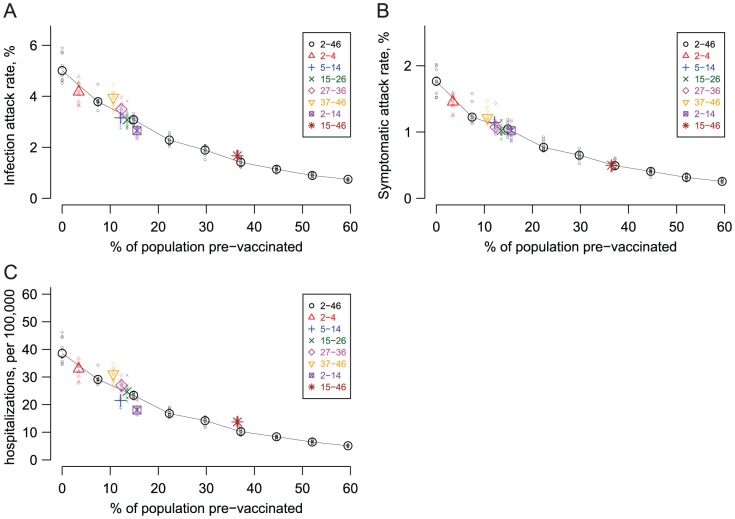
Figure 6. The simulated effects of pre-vaccinating different age cohorts against dengue.
The larger points represent the median attack rates (y-axis) of ten stochastic simulations run when a percentage of the total population (x-axis) is pre-vaccinated. The results from the individual simulations are plotted as small points to show the stochastic variation. The black Os, connected by lines, represent the effect of pre-vaccinating different fractions of individuals from 2 to 46 years old, from 0 to 80% of this cohort, which translates to 0 to 59.5% of the total population. The other symbols are the results from targeting 70% of individuals in narrower age cohorts (expressed in years in the legends) for pre-vaccination. Pre-vaccinating a particular age group can be considered more efficient than vaccinating an equivalent number of people from ages 2 to 46 if it results in a lower attack rate (i.e., the point falls below the line). The vaccine confers immunity to 70% of those vaccinated in the model. (A) Overall infection attack rate vs. pre-vaccination fraction. (B) Overall symptomatic (uncomplicated dengue fever) attack rate vs. pre-vaccination fraction. (C) Overall DSS/DHF cases (hospitalizations) vs. pre-vaccination fraction.

