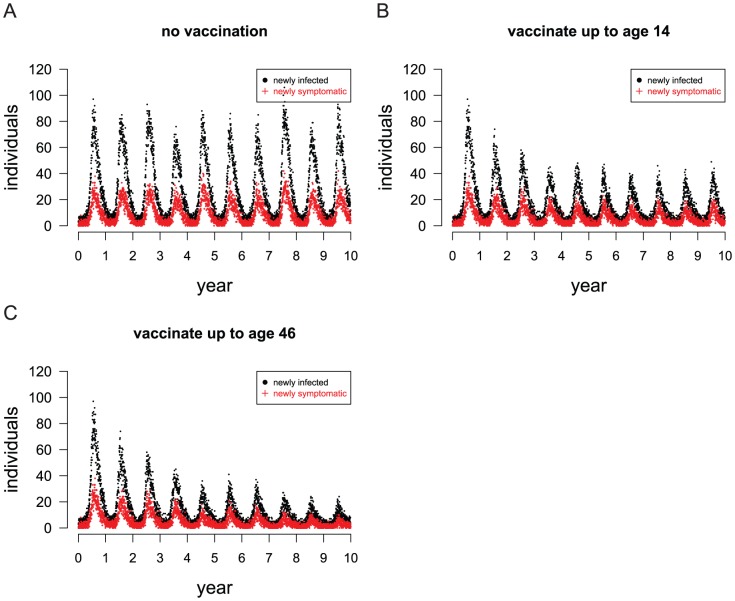
Figure 7. The simulated effect of vaccination on daily infection and illness incidence over ten years.
(A) No vaccination. (B) Vaccine roll-out that covers only children ages 2 to 14 years. (C) Vaccine roll-out that covers children and adults ages 2 to 46 years. 70% of each age cohort is vaccinated, and the vaccine confers all-or-none protection to 70% of vaccinees. The points indicate the number of newly infected or symptomatic people during a single day in a single representative stochastic simulation.

