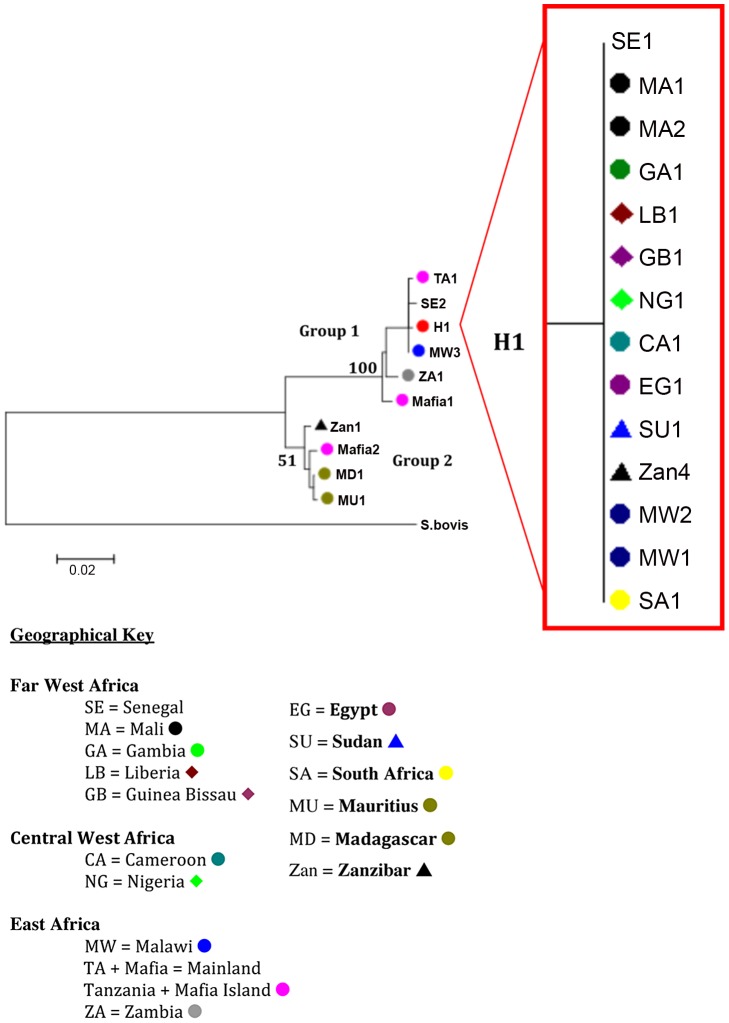
Figure 3. Neighbour-joining nad1 tree topology supporting the topology of the cox1 tree.
Nodal supports for the 2 groups are marked and details of the samples representing H1, “red dot”, are shown in the sub tree. Each terminal branch is labelled with the individual haplotype codes as detailed in Table S1.

