
Figure 3. CHI3L1 levels in haematuria positive and haematuria negative individuals.
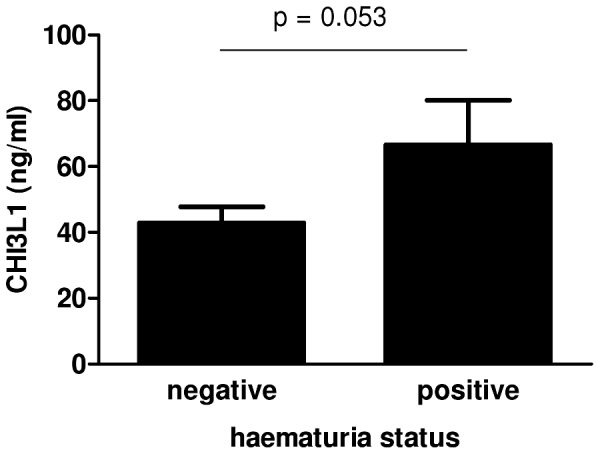
CHI3L1 levels according to haematuria status. P values are obtained from t-test on age, sex and infection status matched individuals.
Official websites use .gov
A
.gov website belongs to an official
government organization in the United States.
Secure .gov websites use HTTPS
A lock (
) or https:// means you've safely
connected to the .gov website. Share sensitive
information only on official, secure websites.
CHI3L1 levels according to haematuria status. P values are obtained from t-test on age, sex and infection status matched individuals.