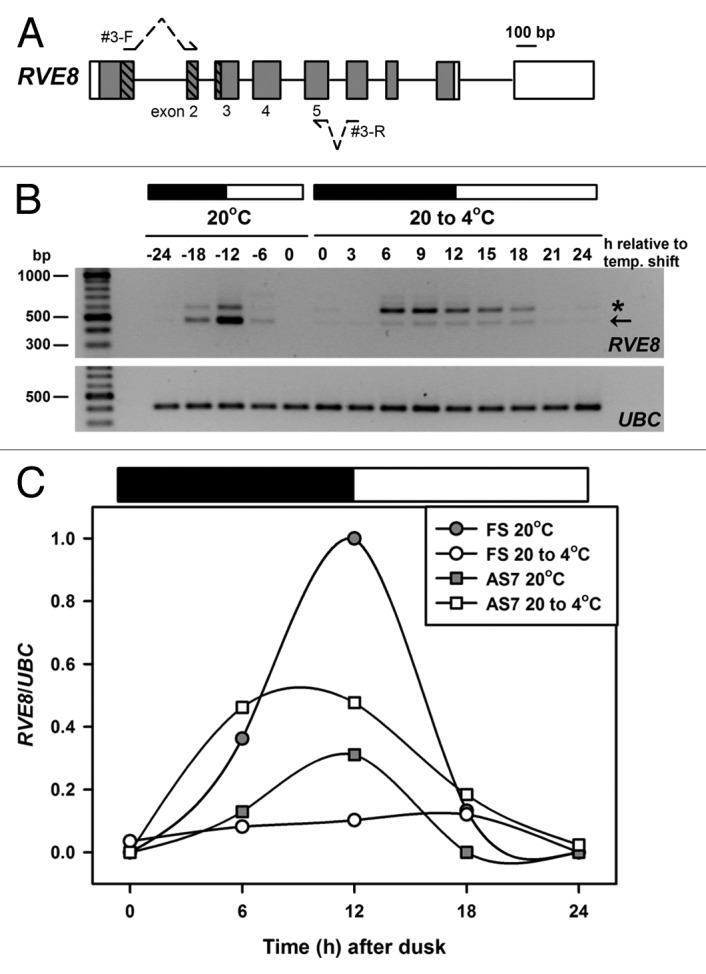
Figure 2. Temperature associated AS of RVE8. (A) RVE8 gene organization is as outlined in Figure 1A. To preclude potential amplification of gDNA during RT-PCR both forward and reverse primers – shown as arrows interrupted with dotted lines – spanned an intron and had the potential to amplify AS transcripts between exons 2 and 5. Primer sequences are: RVE8#3-F; TGAAGCACTTCAACTGTTTGATCGTGACTG and RVE8#3-R; ATCAGGAACACCGTGAAGCACTGGA. Bases in bold are separated by an intron in the RVE8 gDNA sequence. (B) RT-PCR amplification of RVE8, using the primer sequences described above, for plants harvested during diurnal cycles of 12 h dark and 12 h light (denoted by the dark and white bars, respectively) either at ambient temperature (20°C) or during a low temperature transition (20 to 4°C). The cooling temperature shift was initiated at dusk at 20°C and samples are labeled as relative to the temperature shift. Arrow denotes the fully spliced or canonical RT-PCR product (predicted size 481 bp), and the star an AS product, representing transcripts retaining intron 4 (AS7, predicted size 599 bp, see also Figure 1B and Table 1). Note that samples are every 6 h at 20°C and every 3 h during the cold transition. For more details of Methods, and for the UBC primer sequences, see15 (C) RVE8 FS and AS7 RT-PCR band intensities (normalized to the UBC positive controls) from panel B were plotted across the diurnal cycles of 12 h dark and 12 h light (denoted by the dark and white bars, respectively) either at ambient temperature (20°C) or during a low temperature transition (20 to 4°C). Band intensities were determined using a BioRad GelDoc 2000 imaging system and QuantityOne software.
