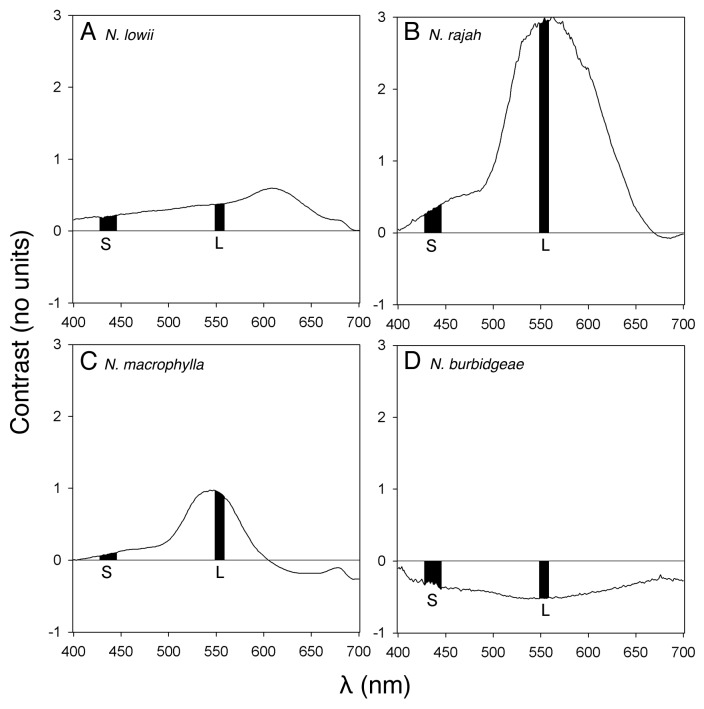
Figure 2. Color contrast patterns (no units) across the waveband 400–700 nm, between pitcher lid and peristome (pitcher lid and flared inner section of pitcher body for Nepenthes lowii). (A) Nepenthes lowii (n = 33). (B) Nepenthes rajah (n = 31). (C) Nepenthes macropylla (n = 28). (D) Nepenthes burbidgeae (n = 10). The black bars denote the visual sensitivity regions of the S and L cones (sensitive to blue and green light, respectively) of tree shrew retinas.

An official website of the United States government
Here's how you know
Official websites use .gov
A
.gov website belongs to an official
government organization in the United States.
Secure .gov websites use HTTPS
A lock (
) or https:// means you've safely
connected to the .gov website. Share sensitive
information only on official, secure websites.
