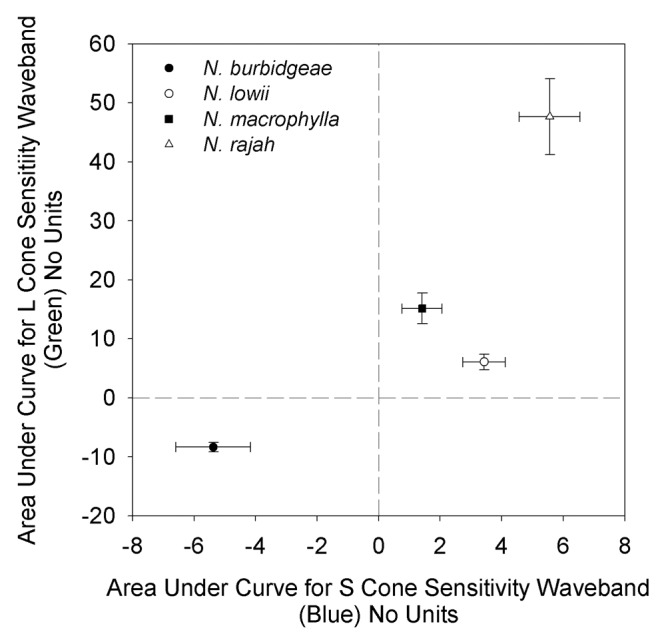
Figure 3. Area under curve (AUC; no units) for color contrast between pitcher lid and peristome (pitcher lid and flared inner section of pitcher body for Nepenthes lowii) in wavebands corresponding to visual sensitivity regions of tree shrew S cones (sensitive to blue light; x axis) and L cones (sensitive to green light; y axis). Closed circle, Nepenthes burbidgeae (n = 10); open circle, Nepenthes lowii (n = 33); closed square, Nepenthes macrophylla (n = 28); open triangle, Nepenthes rajah (n = 31). Points represent mean values, bars represent 1 SE. Species sharing the same lower case italicized letter are not statistically different (p > 0.05, Dunn's test) with respect to L cones (above vertical bars), or S cones (to right of horizontal bars), respectively.
