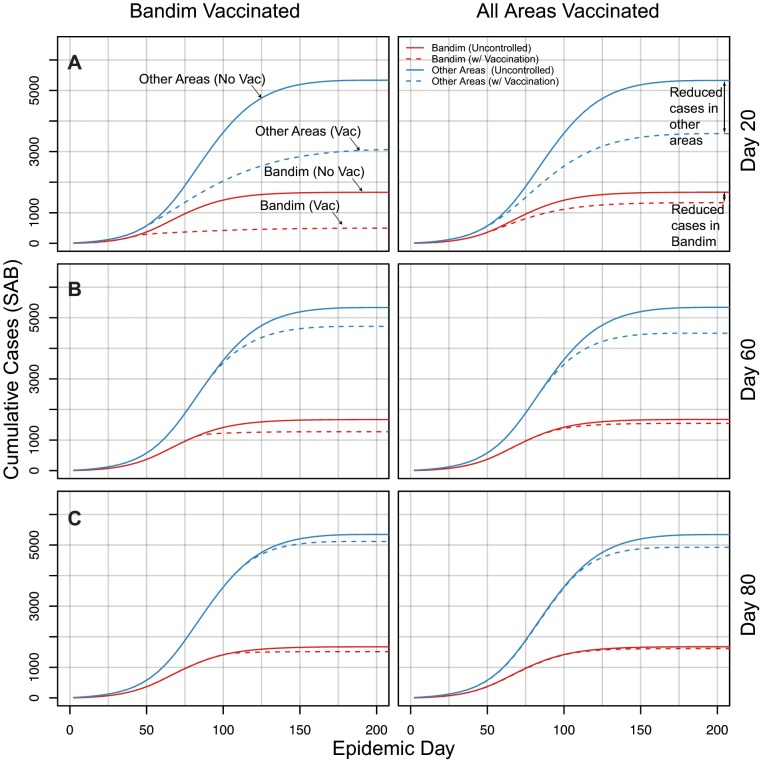
Figure 6. Comparison of cumulative cases within (red) and outside (blue) Bandim under targeted and diffuse vaccination.
Dashed lines represent the median number of cases in simulations with vaccination, and the solid lines represent the median number of cases in uncontrolled epidemic simulations (no vaccination). Each row (panels A–C) represents simulations with vaccination started at the epidemic day denoted on the right hand side (e.g. Day 20). Simulations were started from the reported number of cases in the first 5 days of the epidemic.

