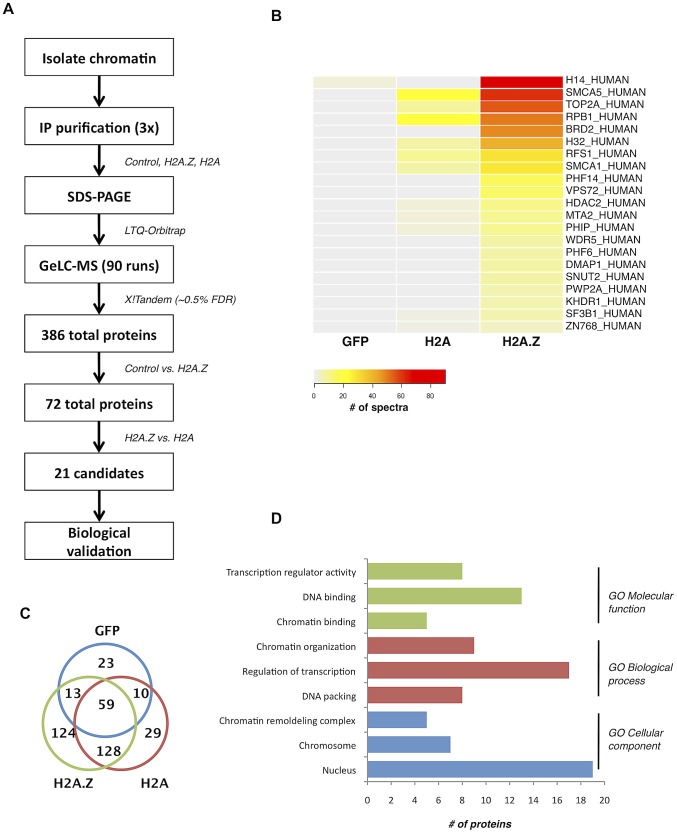
Figure 1. Nucleosome IP/Mass spectrometry approach for the identification of H2A.Z-nucleosome interacting proteins.
A. Schematic of the nucleosome IP & mass spectrometry protocol used. B. Heat map of spectral counts from amalgamated data showing the top 21 protein hits. C. Venn diagram summarizing the number of unique and overlapping hits between H2A.Z nucleosomes, H2A nucleosomes, and the Flag-tagged GFP control. D. Gene ontology analysis of the proteins identified in our MS analysis.

