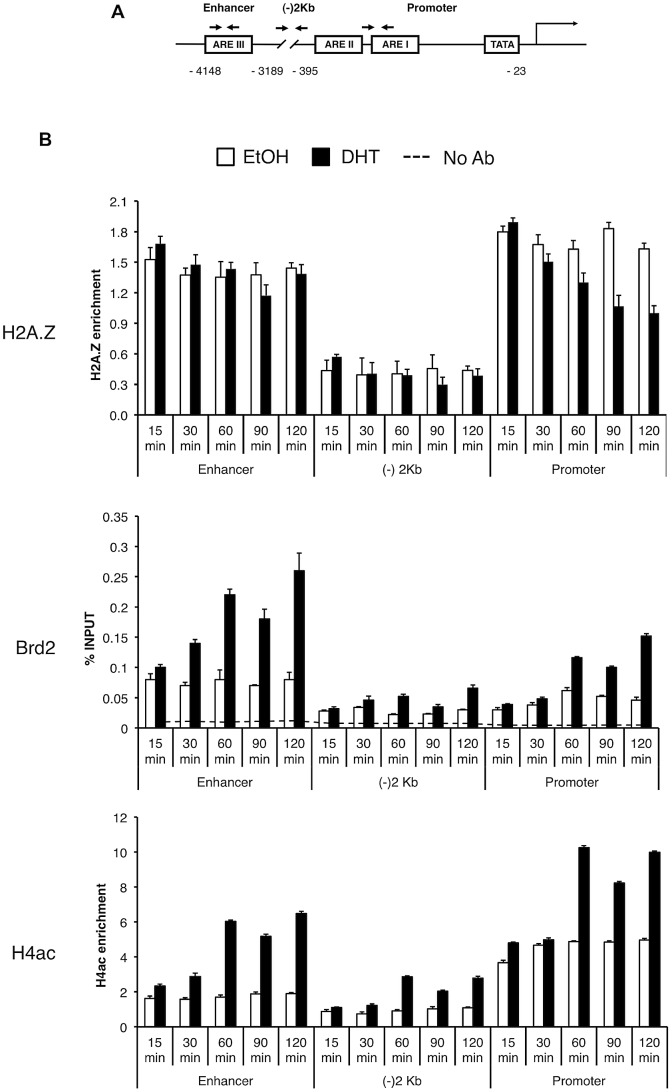
Figure 5. Brd2 is recruited to AR–regulated genes in hormone-stimulated cells.
A. A schematic of the prostate specific antigen (PSA) gene. Arrows indicate approximate positions of primers used for qPCR analysis. “(−)2 Kb” represents the region in between the enhancer and promoter and was used as a negative control region, which is approximately 2 kb upstream of the transcription start site. B. ChIP analysis of the PSA gene following a time-course of androgen stimulation (10 nM)—antibodies used for immunoprecipitation are shown on the left. H2A.Z and H4Ac (tetra-acetylated H4) ChIP data were normalized to total H3 signal (data not shown) to account for changes in nucleosome density and are therefore presented as “H2A.Z/H4Ac enrichment”. Each qPCR reaction was performed in triplicate with each experiment repeated at least three times independently. Values are presented as means, ± standard deviation.

