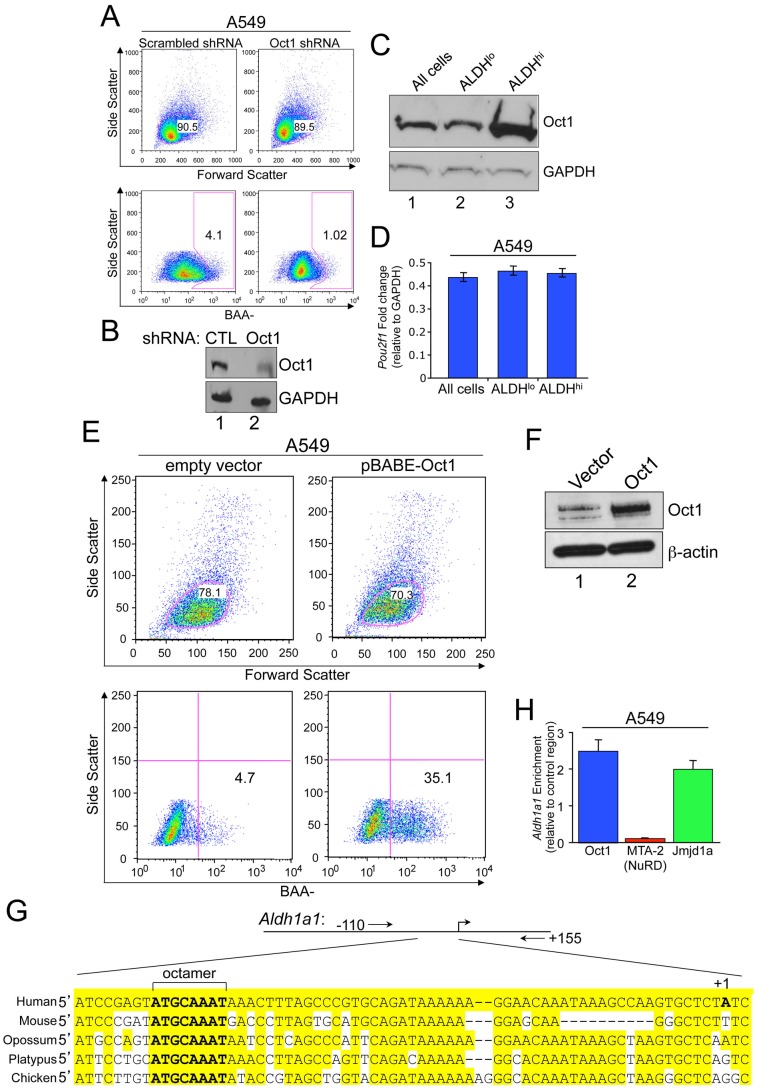
Figure 3. Oct1 controls the AldefluorHI population in human tumor cell lines.
A. Aldefluor staining profile of A549 cells infected with a doxycycline-inducible lentiviral shRNA. MFI was 169.0 for scrambled and 91.2 for Oct1-specific shRNA. A549 cells were infected with control or Oct1-specific lentiviral particles (Santa Cruz), selected with puromycin, and subjected to analysis after 48 hr. B. Efficacy of the A549 knockdown as assessed by Western blotting using anti-Oct1 antibodies and an anti-GAPDH loading control. C. Oct1 Western blot of unsorted normal A549 cells cultured under normal conditions, and sorted AldefluorHI and AldefluorLO populations is shown. GAPDH is used as a loading control. D. The same sorted cells or unsorted cells were subjected to qRT-PCR to determine Oct1 mRNA levels. Levels are show relative to GAPDH. Error bars depict standard deviations. E. Oct1 was ectopically expressed in A549 cells using a retrovirus (pBabe-Oct1) or empty vector. The mixed population of cells was subjected to selection with puromycin, and ALDH activity determined. F. Western blot using anti-Oct1 antibodies of the same cells shown in (E). ß-actin is shown as a loading control. G. Alignment of the Aldh1a1 promoter regions in several example vertebrate species. The conserved perfect octamer sequence centered at approximately −55 bp relative to the transcription start site is highlighted. Alignments were generated using a Clustal W-based algorithm within the Vector NTI software package (Invitrogen). Positions of PCR primer pairs for ChIP amplification are also shown. H. Quantification of ChIP enrichment using A549 cells and specific antibodies directed against Oct1, Mta2 (a component of the NuRD complex) and Jmjd1a. The PCR primer pair spanned the human Aldh1a1 octamer site. ChIP enrichment was quantified relative to isotype control anti-C/EBPß antibodies and relative to a control region as described in the methods section. Values are the average of four independent experiments. Error bars represent standard deviations.

