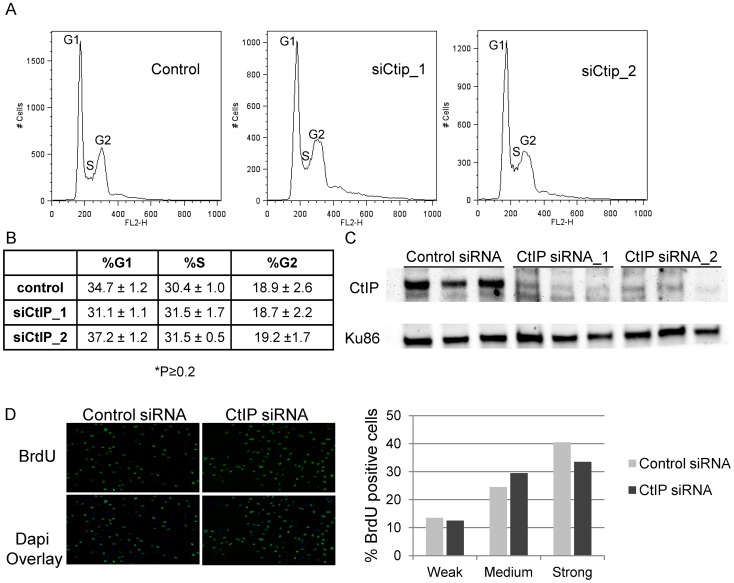
Figure 2. Effects of depletion of CtIP on cell cycle and BrdU incorporation.
(A) Cell cycle profiles of control and siCtIP transfected HeLa cells 48 hours after transfection. Labels mark the cell populations in the G1 (left peak), S (saddle), and G2 (right peak) phases of the cell cycle based on their DNA content. (B) Summary of cell cycle distributions in control and siRNA transfected HeLa cells. Percentages shown are averages of the results of 3 experiments ± the standard deviations. There was no significant difference between the cell cycle distributions of control and CtIP depleted cells (P≥0.2). (C) Immunoblot analysis confirming knockdown of CtIP by two independent siRNAs in 3 independent experiments. Protein extracts were prepared at 48 hours post transfection. Blot was probed with anti-CtIP antibody as indicated on left. A Ku86 was used as a loading control. (D) BrdU incorporation is unaffected in CtIP depleted cells. siRNA transfected HeLa cells were synchronized with thymidine, were released into S-phase 48 hours post transfection, and fixed after 20 minutes BrdU incorporation. Cells were stained for BrdU. Left, Images of fixed control and CtIP depleted cells following staining for BrdU. Right, Quantification of relative BrdU signal in control and CtIP depleted cells.

