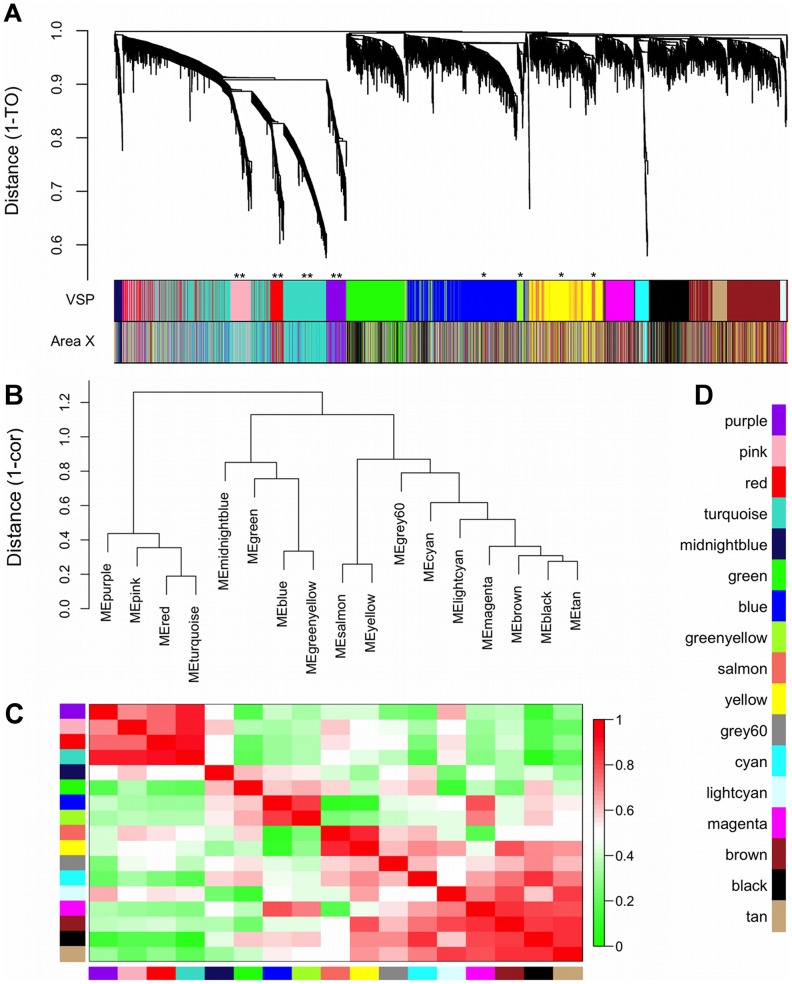
Figure 2. Gene co-expression modules and meta-modules.
(A) Dendrogram shows the results of hierarchically clustering genes in the VSP. “Leaves” along “branches” represent gene probes. The y-axis represents network distance as determined by 1 – topological overlap (TO), where values closer to 0 indicate greater similarity of probe expression profiles across samples. Color blocks below denote modules in the VSP (top) and area X (bottom) that probes were assigned to in each region. Area X module colors were set to match the VSP colors as closely as possible, thus blocks of color that match in the 2 bands indicate VSP module preservation in area X (e.g. **pink, red, turquoise, purple). *Unpreserved modules: blue, green-yellow, yellow, and salmon. (B) Dendrogram shows the results of hierarchically clustering VSP module eigengenes (MEs) to examine higher-order relationships between the modules. “Leaves” along “branches” represent MEs. The y-axis represents network distance as determined by 1 – correlation, where values closer to 0 indicate greater similarity between main sources of expression perturbation in the modules. (C) Heatmap representing correlations between VSP MEs. Each row/column represent a ME, indicated by module color blocks on the x- and y-axes. Dark red indicates strong positive correlation, dark green indicates strong negative correlation, and white indicates no correlation, as indicated in color scale bar. Cells on the diagonal are dark red because each ME correlates perfectly with itself. (D) Color key for all VSP modules. The same colors are used throughout subsequent figures.

