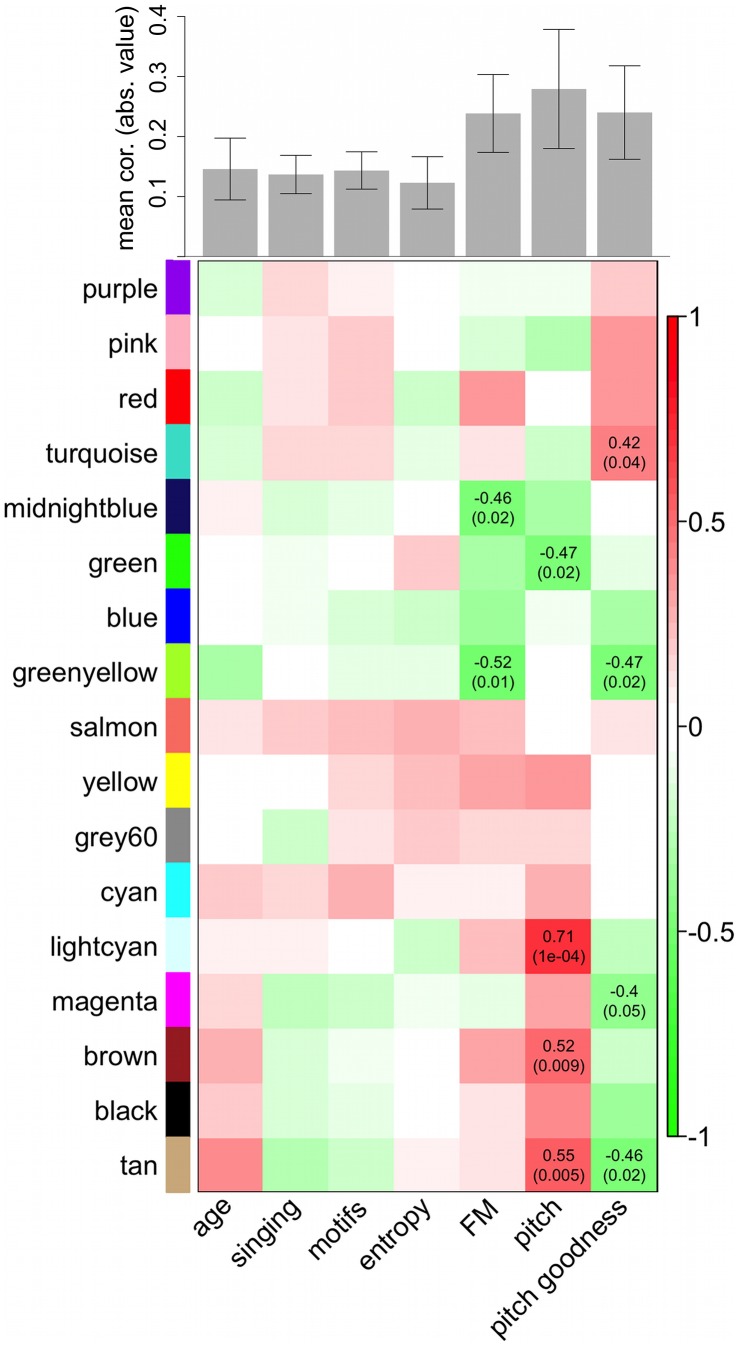
Figure 5. Relationships between VSP co-expression modules and quantitative traits.
Top: Barplot showing average strength of VSP ME correlations to traits. Each bar represents the mean absolute value of correlations for the trait (column) in the heatmap it is above. Error bars denote 95% confidence intervals. Overall, correlation to traits important in area X (singing, motifs, entropy) was no stronger than to age, but there were surprisingly high correlations to FM, pitch, and pitch goodness. Bottom: Heatmap of correlations between VSP MEs (rows) and age and singing-related trait measurements (columns). Correlation coefficients with corresponding Student asymptotic p-values (parentheses) are shown in cells where p<0.05. Scale bar (right) indicates the range of possible correlations from positive (red, 1) to negative (green, −1).

