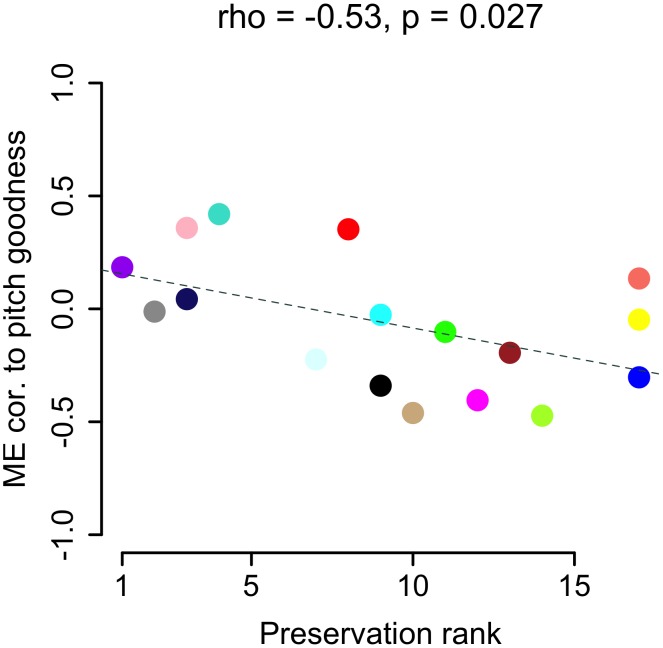
Figure 6. VSP module correlation to pitch goodness predicts preservation in area X.
VSP ME correlations to pitch goodness (y-axis, same values as in pitch goodness column of heatmap in Figure 5 ) plotted as a function of module preservation rank in area X (x-axis, rank of 1 indicates most preserved). Each circle represents a module, colored accordingly, e.g. the blue module was one of the least preserved in area X and had a negative correlation to pitch goodness, while the turquoise module was one of the most preserved and had a positive correlation to pitch goodness. The dashed line represents the linear regression of ME-pitch goodness correlations on preservation rank, with Spearman's rho and p-value shown at top.

